#AUDUSD @ 0.69008 seesaws around intraday high as full markets recall US Dollar bulls. (Pivot Orderbook analysis)
…
This is a premium post.
[s2If !current_user_can(access_s2member_level4)]Please register for PREMIUM VERSION HERE to read full post below containing analysis. In case of any error or you think you are not able to read the full post below, please email us at support#nehcap.com [lwa][/s2If] [s2If current_user_can(access_s2member_level4)]
- AUD/USD seesaws around intraday high as full markets recall US Dollar bulls.
- RBA Minutes, Aussie PMIs came in firmer but failed to underpin recovery amid geopolitical fears.
- Risk catalysts eyed for intermediate directions ahead of US PMIs for February, Fed Minutes appear the key.
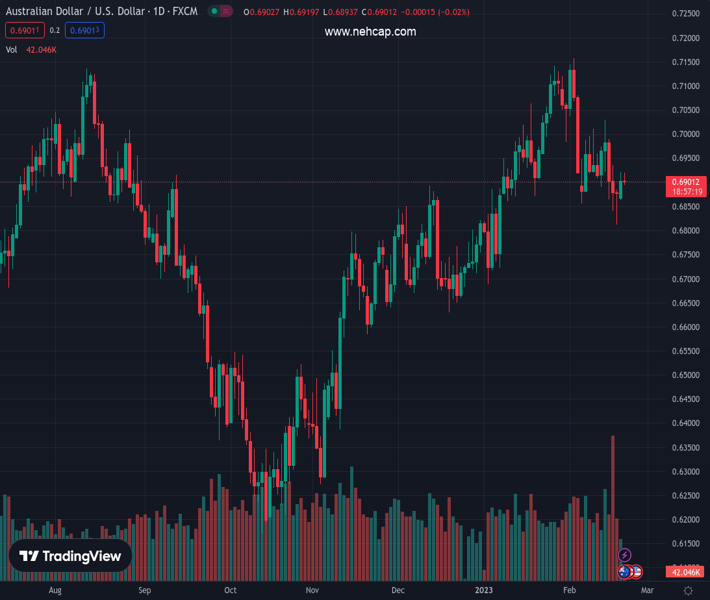
The pair currently trades last at 0.69008.
The previous day high was 0.6921 while the previous day low was 0.6862. The daily 38.2% Fib levels comes at 0.6898, expected to provide support. Similarly, the daily 61.8% fib level is at 0.6885, expected to provide support.
AUD/USD fades bounce off intraday low while printing mild losses near 0.6900 during early Tuesday. In doing so, the Aussie pair fails to cheer the hawkish Minutes Statement from the Reserve Bank of Australia (RBA), as well as the upbeat Australian activity data. The reason could be linked to the market’s risk-off mood and the US Dollar’s rebound during the first trading day of the week.
US Dollar Index (DXY) snaps a two-day losing streak while marking mild gains near 104.00. In doing so, the greenback’s gauge versus the six major currencies traces the US Treasury bond yields, as well as benefits from the traditional haven status. That said, the US 10-year Treasury bond yields pick up bids to near the highest levels marked since early November 2022, mildly bid around 3.86% at the latest.
While portraying the mood, S&P 500 Futures declined 0.40% intraday to 4,070 at the latest.
Elsewhere, the latest RBA Meeting Minutes signaled that the monetary policy board considered a hike of 25 basis points (bps) or 50bp but not discussed a pause in the rate hikes. The Minutes Statement also raised doubts about the frequent hawkish moves and weighed on the AUD/USD while mentioning, “Monthly meetings allowed for frequent adjustments, rates had already risen substantially.”
It should be noted that the first readings of Australia’s S&P Global PMIs came in better than forecasts in February. However, only Manufacturing PMI crossed the 50.0 benchmark that divides activity contraction from expansion.
On a different page, the US and China alleged each other over the balloon shooting whereas the US diplomatic ties with Taiwan teased Beijing on Monday, which in turn weighed on the sentiment and the risk barometer AUD/USD pair. On the same line, the United Nations (UN) Security Council is alarmed by Japan for North Korea’s missile testing and could help the US Dollar to remain firmer due to its safe-haven status.
Looking forward, a few more PMIs, especially from the US, will be important for the AUD/USD pair traders but major attention should be given to the risk catalysts and the Fed Minutes for clear directions. Should the US data track the recent pattern of posting positive surprises and/or the FOMC Minutes also portray the hawkish mood, the Aussie pair will have a further downside to track.
Although the 50-DMA puts a floor under the AUD/USD price near 0.6890, the recovery moves need validation from a 13-day-old resistance line, close to 0.6950 by the press time.
Technical Levels: Supports and Resistances
AUDUSD currently trading at 0.6904 at the time of writing. Pair opened at 0.6913 and is trading with a change of -0.13% % .
| Overview | Overview.1 | |
|---|---|---|
| 0 | Today last price | 0.6904 |
| 1 | Today Daily Change | -0.0009 |
| 2 | Today Daily Change % | -0.13% |
| 3 | Today daily open | 0.6913 |
The pair is trading below its 20 Daily moving average @ 0.6989, above its 50 Daily moving average @ 0.6891 , above its 100 Daily moving average @ 0.6711 and above its 200 Daily moving average @ 0.6805
| Trends | Trends.1 | |
|---|---|---|
| 0 | Daily SMA20 | 0.6989 |
| 1 | Daily SMA50 | 0.6891 |
| 2 | Daily SMA100 | 0.6711 |
| 3 | Daily SMA200 | 0.6805 |
The previous day high was 0.6921 while the previous day low was 0.6862. The daily 38.2% Fib levels comes at 0.6898, expected to provide support. Similarly, the daily 61.8% fib level is at 0.6885, expected to provide support.
Note the levels of interest below:
- Pivot support is noted at 0.6877, 0.6841, 0.6819
- Pivot resistance is noted at 0.6935, 0.6957, 0.6993
| Levels | Levels.1 |
|---|---|
| Previous Daily High | 0.6921 |
| Previous Daily Low | 0.6862 |
| Previous Weekly High | 0.7030 |
| Previous Weekly Low | 0.6812 |
| Previous Monthly High | 0.7143 |
| Previous Monthly Low | 0.6688 |
| Daily Fibonacci 38.2% | 0.6898 |
| Daily Fibonacci 61.8% | 0.6885 |
| Daily Pivot Point S1 | 0.6877 |
| Daily Pivot Point S2 | 0.6841 |
| Daily Pivot Point S3 | 0.6819 |
| Daily Pivot Point R1 | 0.6935 |
| Daily Pivot Point R2 | 0.6957 |
| Daily Pivot Point R3 | 0.6993 |
[/s2If]
Join Our Telegram Group
")


