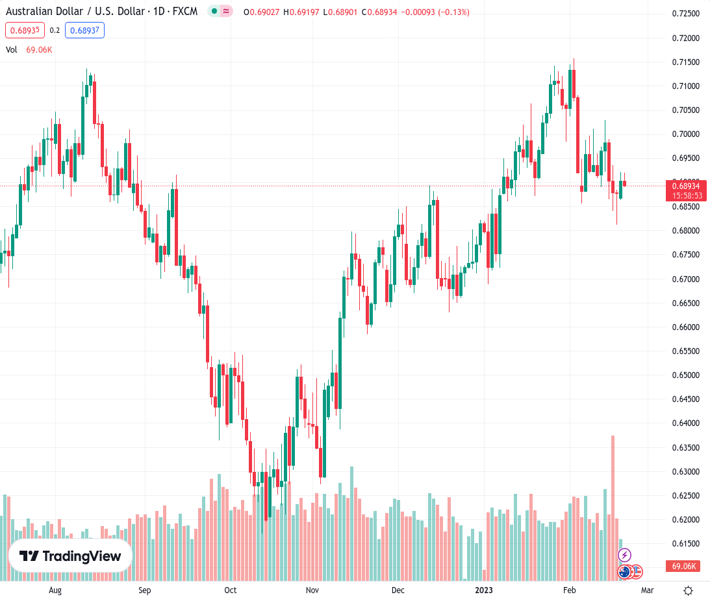
#AUDUSD @ 0.68953 has shifted its auction profile below 0.6900 amid the risk-off mood. (Pivot Orderbook analysis)
…
This is a premium post.
[s2If !current_user_can(access_s2member_level4)]Please register for PREMIUM VERSION HERE to read full post below containing analysis. In case of any error or you think you are not able to read the full post below, please email us at support#nehcap.com [lwa][/s2If] [s2If current_user_can(access_s2member_level4)]
- AUD/USD has shifted its auction profile below 0.6900 amid the risk-off mood.
- Federal Reserve policymakers have been citing it would be premature to consider a pause in the policy tightening spell this year.
- Reserve Bank of Australia also considered the option of a 50 bps rate hike as the Australian inflation has not peaked yet.
- AUD/USD has confidently shifted above the neckline of the Head and Shoulder formation, indicating a bullish reversal.
The pair currently trades last at 0.68953.
The previous day high was 0.6921 while the previous day low was 0.6862. The daily 38.2% Fib levels comes at 0.6898, expected to provide resistance. Similarly, the daily 61.8% fib level is at 0.6885, expected to provide support.
AUD/USD has surrendered the round-level support of 0.6900 in the early European session as investors getting worried that higher interest rates by western central banks are getting nightmares for the producers. The market sentiment is turning risk-averse ahead of the opening of the United States markets after a long weekend.
S&P500 futures have extended their losses as the renewal of higher inflation projections after a significant jump in US Retail Sales has triggered fears of more rate hikes beyond March. The US Dollar Index (DXY) is making deliberate efforts in shifting its auction profile above 103.70. The recovery move by the USD Index in the Asian session was higher confident, however, further range extension is facing pressure.
This week, the show-stopper will be the release of the Federal Open Market Committee (FOMC) minutes, which will release on Wednesday. Investors are expecting a sheer hawkish stance on the interest rate guidance as Federal Reserve (Fed) policymakers have been citing it would be premature considering a pause in the policy tightening spell this year. This has trimmed demand for US government bonds. Lower demand for government bonds has propelled the 10-year yields above 3.85%.
It was widely anticipated that Reserve Bank of Australia Governor Philip Lowe and his mates would be advocating for more interest rate hikes as Australian inflation is critically stubborn. The Australian Consumer Price Index (CPI) has refreshed its multi-decade of 7.8% and is showing no signs of softening ahead in spite of the fact that the Official Cash Rate (OCR) has been already pushed to 3.35%.
The message from the RBA minutes was clear that more interest rates are warranted as strong consumer demand is not allowing Australian inflation to soften from its peak.
According to the RBA minutes, policymakers also considered the option of 50 basis points (bps) interest rate hike considering the persistence of inflation. The RBA members also highlighted that the Unemployment Rate is the lowest in the past 50 years and job vacancies are extremely high, which is delighting households for flushing surplus funds into the economy.
Apart from the hawkish RBA minutes, upbeat preliminary Australian S&P PMI (Feb) data has also failed to strengthen the Australian Dollar. The Manufacturing PMI landed at 50.1, higher than the consensus of 49.9 and the former release of 50.0. The Services PMI scaled firmly to 49.2 versus the estimates of 48.4 and the prior release of 48.6.
Economic activities in the Australian economy are accelerating despite higher interest rates by the Reserve Bank of Australia, which indicates that consumer demand is extremely robust.
In Tuesday’s New York session, preliminary US S&P PMI numbers will be keenly watched. The Manufacturing PMI (Feb) is seen lower at 46.8 vs. the prior release of 46.9. And the Services PMI is seen at 46.6 against the former release of 46.8.
There is no denying the fact that producers have trimmed their dependency on borrowings from commercial banks due to higher interest rates by the Federal Reserve. And are exploiting their retained earnings to avoid higher interest obligations. Firms have postponed their expansion plans, therefore, a continuation of contraction in economic activities is highly expected.
The minutes from the Federal Reserve will provide a detailed explanation of hiking interest rates by 25 basis points (bps) in the February monetary policy meeting.
The street always tries to remain ahead of the Federal Reserve (Fed) policymakers. Therefore, the major focal point for investors in the Federal Open Market Committee (FOMC) minutes is the meaningful cues that could provide guidance on interest rates. Information on the terminal rate and targets for inflation will be keenly watched.
AUD/USD has shifted its business above the neckline of the Head and Shoulder chart pattern plotted from January 10 low at 0.6860 on a four-hour scale. The responsive buying action from the market participants negated the downside break of the above-mentioned chart pattern. The 20-period Exponential Moving Average (EMA) at 0.6900 is acting as a cushion for the Australian Dollar.
The Relative Strength Index (RSI) (14) has rebounded into the 40.00-60.00 range, which indicates a bullish reversal. A break into the bullish range of 60.00-80.00 will trigger the bullish momentum.
Technical Levels: Supports and Resistances
AUDUSD currently trading at 0.6893 at the time of writing. Pair opened at 0.6913 and is trading with a change of -0.29 % .
| Overview | Overview.1 | |
|---|---|---|
| 0 | Today last price | 0.6893 |
| 1 | Today Daily Change | -0.0020 |
| 2 | Today Daily Change % | -0.2900 |
| 3 | Today daily open | 0.6913 |
The pair is trading below its 20 Daily moving average @ 0.6989, above its 50 Daily moving average @ 0.6891 , above its 100 Daily moving average @ 0.6711 and above its 200 Daily moving average @ 0.6805
| Trends | Trends.1 | |
|---|---|---|
| 0 | Daily SMA20 | 0.6989 |
| 1 | Daily SMA50 | 0.6891 |
| 2 | Daily SMA100 | 0.6711 |
| 3 | Daily SMA200 | 0.6805 |
The previous day high was 0.6921 while the previous day low was 0.6862. The daily 38.2% Fib levels comes at 0.6898, expected to provide resistance. Similarly, the daily 61.8% fib level is at 0.6885, expected to provide support.
Note the levels of interest below:
- Pivot support is noted at 0.6877, 0.6841, 0.6819
- Pivot resistance is noted at 0.6935, 0.6957, 0.6993
| Levels | Levels.1 |
|---|---|
| Previous Daily High | 0.6921 |
| Previous Daily Low | 0.6862 |
| Previous Weekly High | 0.7030 |
| Previous Weekly Low | 0.6812 |
| Previous Monthly High | 0.7143 |
| Previous Monthly Low | 0.6688 |
| Daily Fibonacci 38.2% | 0.6898 |
| Daily Fibonacci 61.8% | 0.6885 |
| Daily Pivot Point S1 | 0.6877 |
| Daily Pivot Point S2 | 0.6841 |
| Daily Pivot Point S3 | 0.6819 |
| Daily Pivot Point R1 | 0.6935 |
| Daily Pivot Point R2 | 0.6957 |
| Daily Pivot Point R3 | 0.6993 |
[/s2If]
Join Our Telegram Group
")


