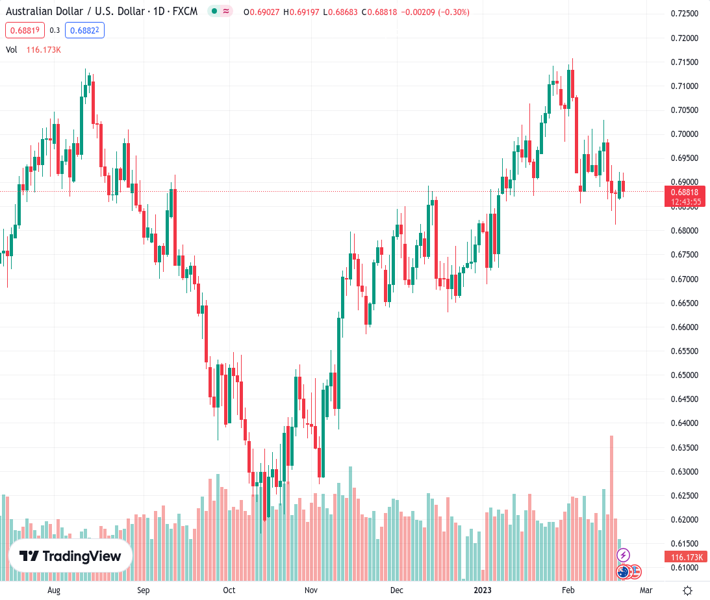
#AUDUSD @ 0.68822 meets with a fresh supply on Tuesday and reverses a major part of the overnight gains. (Pivot Orderbook analysis)
…
This is a premium post.
[s2If !current_user_can(access_s2member_level4)]Please register for PREMIUM VERSION HERE to read full post below containing analysis. In case of any error or you think you are not able to read the full post below, please email us at support#nehcap.com [lwa][/s2If] [s2If current_user_can(access_s2member_level4)]
- AUD/USD meets with a fresh supply on Tuesday and reverses a major part of the overnight gains.
- Hawkish Fed expectations, recession fears boost the USD and weigh on the risk-sensitive Aussie.
- Hawkish-sounding RBA minutes fail to impress bullish traders or lend any support to the major.
The pair currently trades last at 0.68822.
The previous day high was 0.6921 while the previous day low was 0.6862. The daily 38.2% Fib levels comes at 0.6898, expected to provide resistance. Similarly, the daily 61.8% fib level is at 0.6885, expected to provide resistance.
The AUD/USD pair comes under some renewed selling pressure on Tuesday and reverses a major part of the previous day’s positive move. The pair remains depressed below the 0.6900 mark through the first half of the European session and for now, seems to have stalled the recent bounce from its lowest level since January 6 touched last Friday.
A combination of factors pushes the US Dollar higher, which, in turn, is seen weighing on the AUD/USD pair. The prospects for further policy tightening by the Federal Reserve trigger a fresh leg up in the US Treasury bond yields and continue to underpin the Greenback. Apart from this, a generally softer tone around the equity markets further benefits the safe-haven buck and drives flows away from the risk-sensitive Aussie.
The markets now seem convinced that the US central bank will stick to its hawkish stance and have been pricing in at least a 25 bps lift-off at the next two FOMC meetings in March and May. The bets were reaffirmed by the US CPI and PPI data last week, which showed that inflation isn’t coming down quite as fast as hoped. Furthermore, a slew of FOMC members stressed the need to keep lifting rates gradually to tame inflation.
The market sentiment, meanwhile, remains fragile amid growing worries about economic headwinds stemming from rapidly rising borrowing costs. This, along with geopolitical tensions, take temper investors’ appetite for riskier assets. This, to a larger extent, overshadows a more hawkish tilt from the Reserve Bank of Australia (RBA) meeting minutes and does little to impress bullish traders or lend any support to the AUD/USD pair.
In fact, the minutes showed that the Australian central bank had considered raising interest rates by 50 bps during its February meeting, though eventually settled on a 25 bps hike. Furthermore, the board agreed that more interest rate hikes are needed over the coming months to bring down inflation. The AUD/USD pair’s inability to attract any buyers suggests that the recent pullback from a multi-month top is far from being over.
Market participants now look to the US economic docket, featuring the release of flash PMI prints and Existing Home Sales data. This, along with the US bond yields and the broader risk sentiment, could influence the USD price dynamics and provide some impetus to the AUD/USD pair. The focus, however, will remain glued to the latest FOMC meeting minutes, which will play a key role in determining the near-term trajectory.
Technical Levels: Supports and Resistances
AUDUSD currently trading at 0.6875 at the time of writing. Pair opened at 0.6913 and is trading with a change of -0.55 % .
| Overview | Overview.1 | |
|---|---|---|
| 0 | Today last price | 0.6875 |
| 1 | Today Daily Change | -0.0038 |
| 2 | Today Daily Change % | -0.5500 |
| 3 | Today daily open | 0.6913 |
The pair is trading below its 20 Daily moving average @ 0.6989, below its 50 Daily moving average @ 0.6891 , above its 100 Daily moving average @ 0.6711 and above its 200 Daily moving average @ 0.6805
| Trends | Trends.1 | |
|---|---|---|
| 0 | Daily SMA20 | 0.6989 |
| 1 | Daily SMA50 | 0.6891 |
| 2 | Daily SMA100 | 0.6711 |
| 3 | Daily SMA200 | 0.6805 |
The previous day high was 0.6921 while the previous day low was 0.6862. The daily 38.2% Fib levels comes at 0.6898, expected to provide resistance. Similarly, the daily 61.8% fib level is at 0.6885, expected to provide resistance.
Note the levels of interest below:
- Pivot support is noted at 0.6877, 0.6841, 0.6819
- Pivot resistance is noted at 0.6935, 0.6957, 0.6993
| Levels | Levels.1 |
|---|---|
| Previous Daily High | 0.6921 |
| Previous Daily Low | 0.6862 |
| Previous Weekly High | 0.7030 |
| Previous Weekly Low | 0.6812 |
| Previous Monthly High | 0.7143 |
| Previous Monthly Low | 0.6688 |
| Daily Fibonacci 38.2% | 0.6898 |
| Daily Fibonacci 61.8% | 0.6885 |
| Daily Pivot Point S1 | 0.6877 |
| Daily Pivot Point S2 | 0.6841 |
| Daily Pivot Point S3 | 0.6819 |
| Daily Pivot Point R1 | 0.6935 |
| Daily Pivot Point R2 | 0.6957 |
| Daily Pivot Point R3 | 0.6993 |
[/s2If]
Join Our Telegram Group
")


