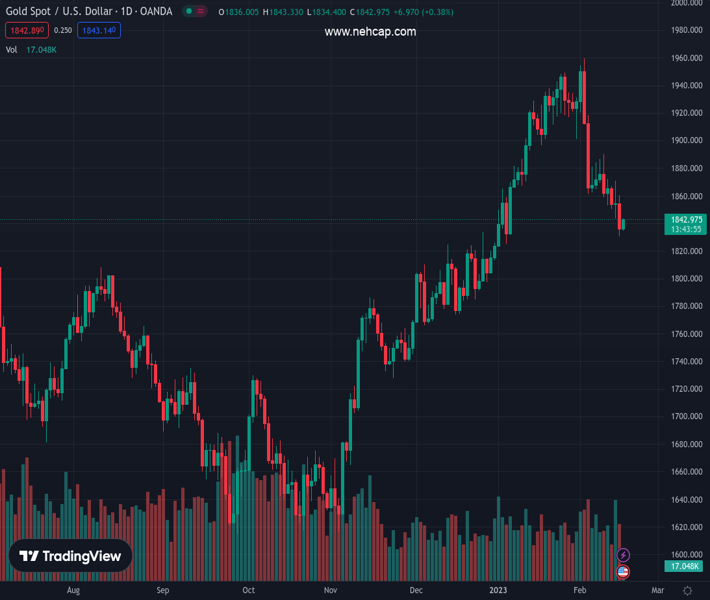
#XAUUSD @ 1,842.72 Gold price edges higher on Thursday and draws support from a modest US Dollar weakness. (Pivot Orderbook analysis)
…
This is a premium post.
[s2If !current_user_can(access_s2member_level4)]Please register for PREMIUM VERSION HERE to read full post below containing analysis. In case of any error or you think you are not able to read the full post below, please email us at support#nehcap.com [lwa][/s2If] [s2If current_user_can(access_s2member_level4)]
- Gold price edges higher on Thursday and draws support from a modest US Dollar weakness.
- Recession fears lend additional support to the XAU/USD, though the upside seems limited.
- Expectations for more rate hikes by Federal Reserve should act as a headwind for Gold price.
The pair currently trades last at 1842.72.
The previous day high was 1860.14 while the previous day low was 1830.6. The daily 38.2% Fib levels comes at 1841.88, expected to provide support. Similarly, the daily 61.8% fib level is at 1848.86, expected to provide resistance.
Gold price attracts some buying on Thursday and recovers a part of the previous day’s losses to the $1,830 area, or its lowest level since January 6. The XAU/USD sticks to its gains through the early European session and is currently hovering near the top boundary of its daily range, around the $1,840 level.
The US Dollar (USD) retreats from a six-week high touched on Wednesday amid a modest downtick in the US Treasury bond yields. This, in turn, is seen as a key factor driving some flows towards the US Dollar-denominated Gold price. Apart from this, fears of a global recession lend additional support to the safe-haven precious metal, though any meaningful upside still seems elusive.
Investors now seem convinced that interest rates are going to remain higher for longer amid stubbornly high inflation. The bets were lifted by Tuesday’s release of the Consumer Price Index (CPI) from the United States (US). In fact, the markets are currently pricing in at least a 25 bps lift-off at each of the next two Federal Open Market Committee (FOMC) meetings in March and in May.
Furthermore, several FOMC policymakers, including Fed Chair Jerome Powell, recently stressed the need for additional interest rate hikes to fully gain control of inflation. This should act as a tailwind for the US bond yields and lend support to the buck. Hence, it will be prudent to wait for a strong follow-through buying around the non-yielding Gold price before placing bullish bets.
Traders now look to the release of the US Producer Price Index (PPI), which should provide fresh cues about inflationary pressures. This, in turn, will influence expectations about the Fed’s future rate-hiking campaign. Thursday’s US economic docket also features the Philly Fed Manufacturing Index, the usual Weekly Initial Jobless Claims, Building Permits and Housing Starts.
This US macro data, along with the US bond yields, could drive the USD demand. Apart from this, the broader risk sentiment should allow traders to grab short-term opportunities around the Gold price. Nevertheless, the fundamental backdrop seems tilted firmly in favour of the USD bulls and suggests that the path of least resistance for the XAU/USD is to the downside.
From a technical perspective, the overnight downfall validates a breakdown below the 50-day Simple Moving Average (SMA) and adds credence to the negative outlook. Hence, a subsequent fall towards the $1,818-$1,817 intermediate support, en route to the $1,800 round figure, looks like a distinct possibility.
On the flip side, the $1,852-$1,853 region could act as an immediate hurdle ahead of the 50-day SMA, currently around the $1,860 level. Any further move up is more likely to attract fresh sellers and remain capped near the $1,871-$1,872 region, or the weekly high, which should now act as a key pivotal point.
Technical Levels: Supports and Resistances
XAUUSD currently trading at 1839.51 at the time of writing. Pair opened at 1837.62 and is trading with a change of 0.1 % .
| Overview | Overview.1 | |
|---|---|---|
| 0 | Today last price | 1839.51 |
| 1 | Today Daily Change | 1.89 |
| 2 | Today Daily Change % | 0.10 |
| 3 | Today daily open | 1837.62 |
The pair is trading below its 20 Daily moving average @ 1900.11, below its 50 Daily moving average @ 1860.08 , above its 100 Daily moving average @ 1782.92 and above its 200 Daily moving average @ 1775.83
| Trends | Trends.1 | |
|---|---|---|
| 0 | Daily SMA20 | 1900.11 |
| 1 | Daily SMA50 | 1860.08 |
| 2 | Daily SMA100 | 1782.92 |
| 3 | Daily SMA200 | 1775.83 |
The previous day high was 1860.14 while the previous day low was 1830.6. The daily 38.2% Fib levels comes at 1841.88, expected to provide support. Similarly, the daily 61.8% fib level is at 1848.86, expected to provide resistance.
Note the levels of interest below:
- Pivot support is noted at 1825.43, 1813.25, 1795.89
- Pivot resistance is noted at 1854.97, 1872.33, 1884.51
| Levels | Levels.1 |
|---|---|
| Previous Daily High | 1860.14 |
| Previous Daily Low | 1830.60 |
| Previous Weekly High | 1890.27 |
| Previous Weekly Low | 1852.84 |
| Previous Monthly High | 1949.27 |
| Previous Monthly Low | 1823.76 |
| Daily Fibonacci 38.2% | 1841.88 |
| Daily Fibonacci 61.8% | 1848.86 |
| Daily Pivot Point S1 | 1825.43 |
| Daily Pivot Point S2 | 1813.25 |
| Daily Pivot Point S3 | 1795.89 |
| Daily Pivot Point R1 | 1854.97 |
| Daily Pivot Point R2 | 1872.33 |
| Daily Pivot Point R3 | 1884.51 |
[/s2If]
Join Our Telegram Group
")


