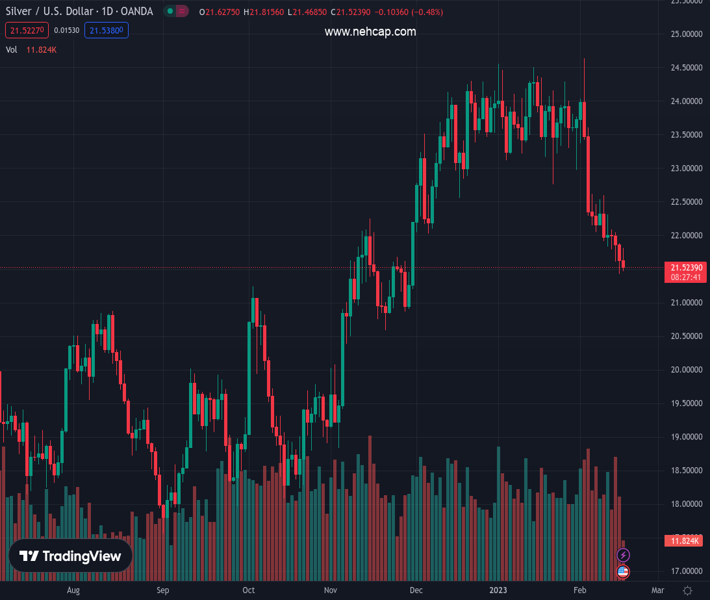
#XAGUSD @ 21.531 Silver fails to capitalize on its modest intraday uptick to the 100-day SMA support breakpoint. (Pivot Orderbook analysis)
…
This is a premium post.
[s2If !current_user_can(access_s2member_level4)]Please register for PREMIUM VERSION HERE to read full post below containing analysis. In case of any error or you think you are not able to read the full post below, please email us at support#nehcap.com [lwa][/s2If] [s2If current_user_can(access_s2member_level4)]
- Silver fails to capitalize on its modest intraday uptick to the 100-day SMA support breakpoint.
- The technical setup supports prospects for an extension of the well-established downtrend.
- Bears, however, might wait for a break below the 50% Fibo. level before placing fresh bets.
The pair currently trades last at 21.531.
The previous day high was 21.88 while the previous day low was 21.43. The daily 38.2% Fib levels comes at 21.6, expected to provide resistance. Similarly, the daily 61.8% fib level is at 21.71, expected to provide resistance.
Silver struggles for a firm direction on Thursday and seesaws between tepid gains/minor losses heading into the North American session. The white metal is currently placed just above the mid-$21.00s and remains well within the striking distance of its lowest level since November 2022 touched on Wednesday.
From a technical perspective, the overnight convincing break and acceptance below the 100-day SMA could be seen as a fresh trigger for bears. That said, oscillators on the daily chart have moved on the verge of breaking into oversold territory. This, in turn, assists the XAG/USD to defend the 50% Fibonacci retracement level of the recent rally from October 2022.
This makes it prudent to wait for some follow-through selling below the aforementioned support, around the $21.40 area, before positioning for a further decline. The XAG/USD might then accelerate the slide
towards a technically significant 200-day SMA, currently near the $21.00 mark. Spot prices could eventually drop to 61.8% Fibo. level support around the $20.60 zone.
On the flip side, the 100-day SMA support breakpoint, around the $21.85 region, now seems to act as an immediate hurdle ahead of the $22.00 mark and the 38.2% Fibo., near the $22.15 area. Any further move up might continue to attract fresh sellers near the $22.60-$22.70 supply zone. This, in turn, should cap the XAG/USD near the $23.00 mark, representing the 23.6% Fibo.
That said, a convincing break through the latter could offset the negative outlook and shift the near-term bias in favour of bullish traders. The subsequent move up has the potential to lift the XAG/USD towards the $24.00 round-figure mark. Bulls might then aim back to challenge the $24.50 supply zone, which if cleared decisively should pave the way for a fresh leg up.
Technical Levels: Supports and Resistances
XAGUSD currently trading at 21.59 at the time of writing. Pair opened at 21.65 and is trading with a change of -0.28 % .
| Overview | Overview.1 | |
|---|---|---|
| 0 | Today last price | 21.59 |
| 1 | Today Daily Change | -0.06 |
| 2 | Today Daily Change % | -0.28 |
| 3 | Today daily open | 21.65 |
The pair is trading below its 20 Daily moving average @ 22.98, below its 50 Daily moving average @ 23.4 , below its 100 Daily moving average @ 21.93 and above its 200 Daily moving average @ 21.01
| Trends | Trends.1 | |
|---|---|---|
| 0 | Daily SMA20 | 22.98 |
| 1 | Daily SMA50 | 23.40 |
| 2 | Daily SMA100 | 21.93 |
| 3 | Daily SMA200 | 21.01 |
The previous day high was 21.88 while the previous day low was 21.43. The daily 38.2% Fib levels comes at 21.6, expected to provide resistance. Similarly, the daily 61.8% fib level is at 21.71, expected to provide resistance.
Note the levels of interest below:
- Pivot support is noted at 21.43, 21.2, 20.97
- Pivot resistance is noted at 21.88, 22.11, 22.34
| Levels | Levels.1 |
|---|---|
| Previous Daily High | 21.88 |
| Previous Daily Low | 21.43 |
| Previous Weekly High | 22.62 |
| Previous Weekly Low | 21.84 |
| Previous Monthly High | 24.55 |
| Previous Monthly Low | 22.76 |
| Daily Fibonacci 38.2% | 21.60 |
| Daily Fibonacci 61.8% | 21.71 |
| Daily Pivot Point S1 | 21.43 |
| Daily Pivot Point S2 | 21.20 |
| Daily Pivot Point S3 | 20.97 |
| Daily Pivot Point R1 | 21.88 |
| Daily Pivot Point R2 | 22.11 |
| Daily Pivot Point R3 | 22.34 |
[/s2If]
Join Our Telegram Group
")


