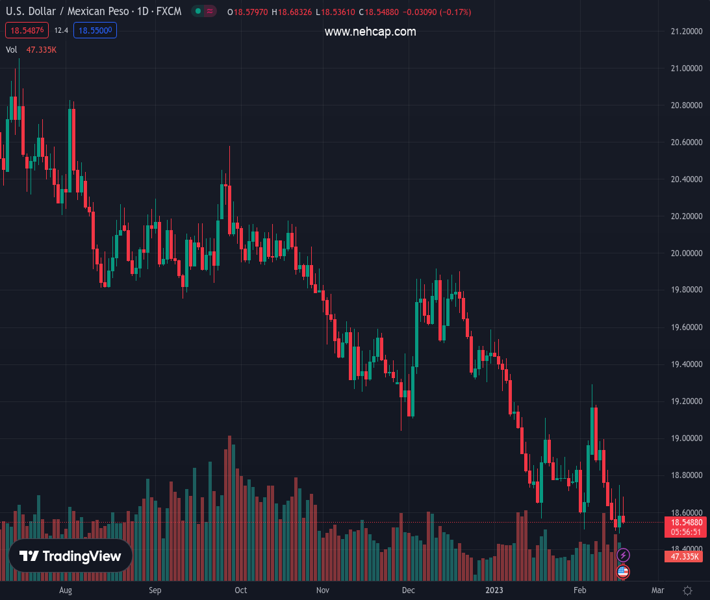
#USDMXN @ 18.5582 clings to its gains, hovering nearby $18.58, after solid US data. (Pivot Orderbook analysis)
…
This is a premium post.
[s2If !current_user_can(access_s2member_level4)]Please register for PREMIUM VERSION HERE to read full post below containing analysis. In case of any error or you think you are not able to read the full post below, please email us at support#nehcap.com [lwa][/s2If] [s2If current_user_can(access_s2member_level4)]
- USD/MXN clings to its gains, hovering nearby $18.58, after solid US data.
- US labor market data show a tight labor market, while the PPI came higher than expected.
- USD/MXN Price Analysis: Is still neutral-downward biased, but positive divergence could make a case for a rally to $19.00.
The pair currently trades last at 18.5582.
The previous day high was 18.754 while the previous day low was 18.5032. The daily 38.2% Fib levels comes at 18.6582, expected to provide resistance. Similarly, the daily 61.8% fib level is at 18.599, expected to provide resistance.
The Mexican Peso (MXN) lost some ground against the US Dollar (USD) on Thursday following US economic data, which sparked speculation that there could be more rate hikes than just two by the Federal Reserve (Fed) as money market futures data showed. At the time of writing, the USD/MXN exchanges hands at around 18.6481.
The US economic calendar is a busy one on Thursday. On the inflation side, the Producer Price index (PPI) for January rose by 0.7% MoM, above estimates of 0.4%, while Core PPI, which excludes volatile items, came at 0.5% vs. 0.3% foreseen. Even though year-over-year data was lower than the previous month, monthly figures underscore stubbornly stickier inflation that might need further tightening by the Fed.
Aside from this, Initial Jobless Claims for the week ending on February 11 hit 194K, below the prior reading of 196K, and below the 200K foreseen by analysts, emphasizing the tightness of the labor market, which remains pending of displaying the effects of 450 bps of rate hikes by the Fed.
In other data, the Philadelphia Fed Manufacturing Index plunged below estimates of -7.4, down to -24.3. Comments from the poll showed that cost increases accelerated for the first time in 10 months, contrarily to their own prices, which slowed down.
According to Reuters, “the survey’s two measures of prices, those paid by producers and those they charge their customers – both closely watched inflation indicators – showed margins were slimming. The prices paid index edged up to 26.5 from 24.5 to mark its first increase since April 2022, while the prices received index fell by 50% to 14.9, the lowest reading since February 2021.”
Meanwhile, the USD/MXN regained some composure after hitting a low of 18.5361. Albeit it hit a daily high of 18.6832, it has remained pressured, by market sentiment, with risk-on impulses increasing demand for the Mexican Peso.
Elsewhere, Cleveland Fed President Loretta Mester said she sees compelling evidence to hike rates by 50 bps in the upcoming meetings. She sees upside risks to inflation and justifies that the scenario supports the case for “overshooting” on policy. “Over-tightening also has costs, but if inflation begins to move down faster than anticipated, we can react appropriately,” Mester said.
From a technical perspective, the USD/MXN remains neutral-downward biased. Still, the positive divergence between the Relative Strength Index (RSI) and price action is looming, meaning that prices could move higher. For a bearish continuation, the USD/MXN needs to break below the YTD low at 18.4836, so it can test the psychological $18.00. On the other hand, if the USD/MXN reclaims the 20-day EMA at 18.7714, the USD/MXN would be poised to challenge $19.00.
Technical Levels: Supports and Resistances
USDMXN currently trading at 18.589 at the time of writing. Pair opened at 18.5819 and is trading with a change of 0.04 % .
| Overview | Overview.1 | |
|---|---|---|
| 0 | Today last price | 18.5890 |
| 1 | Today Daily Change | 0.0071 |
| 2 | Today Daily Change % | 0.0400 |
| 3 | Today daily open | 18.5819 |
The pair remains strongly bearish on the daily time frame. It trades below the 20 SMA @ 18.7888, 50 SMA 19.1396, 100 SMA @ 19.4237 and 200 SMA @ 19.778.
| Trends | Trends.1 | |
|---|---|---|
| 0 | Daily SMA20 | 18.7888 |
| 1 | Daily SMA50 | 19.1396 |
| 2 | Daily SMA100 | 19.4237 |
| 3 | Daily SMA200 | 19.7780 |
The previous day high was 18.754 while the previous day low was 18.5032. The daily 38.2% Fib levels comes at 18.6582, expected to provide resistance. Similarly, the daily 61.8% fib level is at 18.599, expected to provide resistance.
Note the levels of interest below:
- Pivot support is noted at 18.472, 18.3622, 18.2212
- Pivot resistance is noted at 18.7229, 18.8639, 18.9738
| Levels | Levels.1 |
|---|---|
| Previous Daily High | 18.7540 |
| Previous Daily Low | 18.5032 |
| Previous Weekly High | 19.2901 |
| Previous Weekly Low | 18.6390 |
| Previous Monthly High | 19.5361 |
| Previous Monthly Low | 18.5663 |
| Daily Fibonacci 38.2% | 18.6582 |
| Daily Fibonacci 61.8% | 18.5990 |
| Daily Pivot Point S1 | 18.4720 |
| Daily Pivot Point S2 | 18.3622 |
| Daily Pivot Point S3 | 18.2212 |
| Daily Pivot Point R1 | 18.7229 |
| Daily Pivot Point R2 | 18.8639 |
| Daily Pivot Point R3 | 18.9738 |
[/s2If]
Join Our Telegram Group
")


