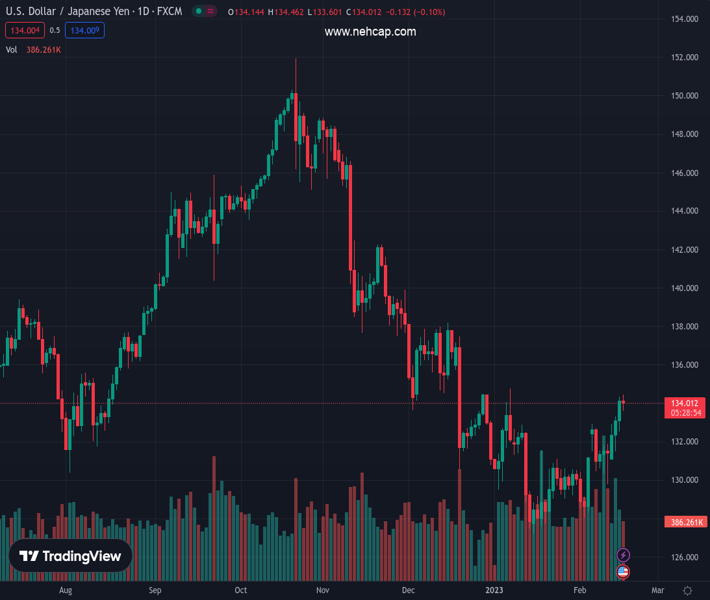
#USDJPY @ 134.080 hit a weekly high of 134.46 but retraced toward the 134.10 area. (Pivot Orderbook analysis)
…
This is a premium post.
[s2If !current_user_can(access_s2member_level4)]Please register for PREMIUM VERSION HERE to read full post below containing analysis. In case of any error or you think you are not able to read the full post below, please email us at support#nehcap.com [lwa][/s2If] [s2If current_user_can(access_s2member_level4)]
- USD/JPY hit a weekly high of 134.46 but retraced toward the 134.10 area.
- USD/JPY Price Analysis: Negative divergence between oscillators and price action could pave the way for downside action.
The pair currently trades last at 134.080.
The previous day high was 134.36 while the previous day low was 132.55. The daily 38.2% Fib levels comes at 133.67, expected to provide support. Similarly, the daily 61.8% fib level is at 133.24, expected to provide support.
The USD/JPY consolidated around the 134.00 area after hitting a daily high of 134.46, though bears stepped in around the highs of the week, dragging prices lower. Hence, the USD/JPY changed its course gears and records minimal losses of 0.08%. The USD/JPY pair is trading around 134.10s on Thursday.
On February 15, the USD/JPY reached a daily high at 134.35, and since then, the USD/JPY has remained sideways within the 133.60/134.30 area. Even though the Relative Strength Index (RSI) is in bullish territory, as USD/JPY price action has headed north, the RSI did not. Hence, a negative divergence could emerge, suggesting that a price reversal looms.
If that scenario plays out, the USD/JPY first support would be this week’s low at 133.60. Break below, and the 20-day Exponential Moving Average (EMA) would be exposed at 133.28, followed by the February 13 daily high-turned support at 132.90.
On an alternate scenario, the USD/JPY’s first resistance would be the day’s high at 134.46, which, once cleared, could lift the USD/JPY to January 6 high at 134.77 before the major climbs to 135.00.
Technical Levels: Supports and Resistances
USDJPY currently trading at 134.18 at the time of writing. Pair opened at 134.11 and is trading with a change of 0.05 % .
| Overview | Overview.1 | |
|---|---|---|
| 0 | Today last price | 134.18 |
| 1 | Today Daily Change | 0.07 |
| 2 | Today Daily Change % | 0.05 |
| 3 | Today daily open | 134.11 |
The pair is trading above its 20 Daily moving average @ 130.78, above its 50 Daily moving average @ 132.05 , below its 100 Daily moving average @ 137.86 and below its 200 Daily moving average @ 136.87
| Trends | Trends.1 | |
|---|---|---|
| 0 | Daily SMA20 | 130.78 |
| 1 | Daily SMA50 | 132.05 |
| 2 | Daily SMA100 | 137.86 |
| 3 | Daily SMA200 | 136.87 |
The previous day high was 134.36 while the previous day low was 132.55. The daily 38.2% Fib levels comes at 133.67, expected to provide support. Similarly, the daily 61.8% fib level is at 133.24, expected to provide support.
Note the levels of interest below:
- Pivot support is noted at 132.99, 131.86, 131.17
- Pivot resistance is noted at 134.8, 135.48, 136.61
| Levels | Levels.1 |
|---|---|
| Previous Daily High | 134.36 |
| Previous Daily Low | 132.55 |
| Previous Weekly High | 132.91 |
| Previous Weekly Low | 129.81 |
| Previous Monthly High | 134.78 |
| Previous Monthly Low | 127.22 |
| Daily Fibonacci 38.2% | 133.67 |
| Daily Fibonacci 61.8% | 133.24 |
| Daily Pivot Point S1 | 132.99 |
| Daily Pivot Point S2 | 131.86 |
| Daily Pivot Point S3 | 131.17 |
| Daily Pivot Point R1 | 134.80 |
| Daily Pivot Point R2 | 135.48 |
| Daily Pivot Point R3 | 136.61 |
[/s2If]
Join Our Telegram Group
")


