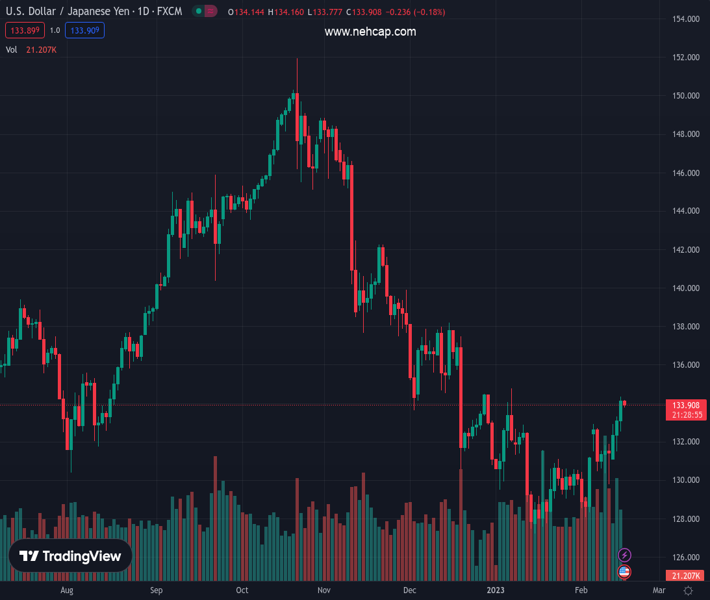
#USDJPY @ 133.909 consolidates recent gains at the six-week high, snaps three-day uptrend. (Pivot Orderbook analysis)
…
This is a premium post.
[s2If !current_user_can(access_s2member_level4)]Please register for PREMIUM VERSION HERE to read full post below containing analysis. In case of any error or you think you are not able to read the full post below, please email us at support#nehcap.com [lwa][/s2If] [s2If current_user_can(access_s2member_level4)]
- USD/JPY consolidates recent gains at the six-week high, snaps three-day uptrend.
- Japan trade deficit for January improves as imports ease, exports grow.
- US Treasury bond yields refresh multi-day top as US data propel hawkish Fed bets.
- BoJ concerns remain upbeat as well amid more hawks in new leadership board.
The pair currently trades last at 133.909.
The previous day high was 134.36 while the previous day low was 132.55. The daily 38.2% Fib levels comes at 133.67, expected to provide support. Similarly, the daily 61.8% fib level is at 133.24, expected to provide support.
USD/JPY takes offers to refresh intraday low while paring the recent gains around the highest levels in 1.5 months, down 0.25% on a day near 133.80 as Tokyo opens for Thursday. In doing so, the Yen pair prints the first daily loss in four amid upbeat Japanese trade data and fresh calls for hawkish moves from the Bank of Japan (BoJ). Even so, the hawkish concerns surrounding the Federal Reserve (Fed) join strong Treasury bond yields to keep the buyers hopeful.
As per the latest Japan Merchandise Trade Balance Total for January, the trade deficit improved to ¥-3,496.6B versus ¥-3,871.5B expected and ¥-1,451.8B prior (revised). The details suggest that Exports grew 3.5% versus 0.8% expected and 11.5% previous readings while the Imports eased to 17.8% versus 18.4% market forecasts and 20.7% prior. Elsewhere, Japan’s Machinery Orders rose by 1.6% MoM versus 3.0% expected and -8.3% prior.
Elsewhere, concerns surrounding the Bank of Japan’s (BoJ) exit from the Yield Curve Control (YCC) policy gained momentum of late as the nominated BoJ Leader Kazuo Ueda has a market impression as the policy hawks.
On the other hand, the US 10-year Treasury bond yields seesaw around a six-week high, marked the previous day, while the US Dollar Index (DXY) bulls take a breather after rising to a 1.5-month top as the key US data hints at a further increase in the Federal Reserve’s (Fed) interest rates. That said, the market’s bets on the Fed’s next moves, as per the FEDWATCH tool of Reuters, suggest that the US central bank rates are to peak in July around 5.25% versus the December Federal Reserve prediction of 5.10% top rate.
On Wednesday, US Retail Sales growth jumped to 3.0% YoY in January versus 1.8% expected and -1.1% prior. Further, The Retail Sales ex-Autos grew by 2.3% in the same period, compared to analysts’ estimate of +0.8%. On the same line, the NY Empire State Manufacturing Index for February improved to a three-month high of -5.8 versus -18.0 expected and -32.9 market forecasts. Alternatively, the US Industrial Production marked 0.0% MoM figures for January, compared to analysts’ estimate of 0.5% and -0.7% previous readings, but failed to push back the hawkish bias surrounding the Federal Reserve’s (Fed) next move.
Against this backdrop, Wall Street benchmarks closed with mild gains, following the day-end recovery, but S&P 500 Futures hesitate in following suit. It should be noted that Japan’s Nikkei 225 begins the day on a positive side.
Moving on, risk catalysts and the second-tier US data concerning the housing market, industrial activity and producer prices will be eyed for clear directions but major attention will be given to the central bank chatters.
A convergence of the one-month-old previous resistance line and the 200-day Exponential Moving Average (EMA), highlights 133.75 as the short-term key support for the USD/JPY traders to watch.
Technical Levels: Supports and Resistances
USDJPY currently trading at 133.8 at the time of writing. Pair opened at 134.11 and is trading with a change of -0.23% % .
| Overview | Overview.1 | |
|---|---|---|
| 0 | Today last price | 133.8 |
| 1 | Today Daily Change | -0.31 |
| 2 | Today Daily Change % | -0.23% |
| 3 | Today daily open | 134.11 |
The pair is trading above its 20 Daily moving average @ 130.78, above its 50 Daily moving average @ 132.05 , below its 100 Daily moving average @ 137.86 and below its 200 Daily moving average @ 136.87
| Trends | Trends.1 | |
|---|---|---|
| 0 | Daily SMA20 | 130.78 |
| 1 | Daily SMA50 | 132.05 |
| 2 | Daily SMA100 | 137.86 |
| 3 | Daily SMA200 | 136.87 |
The previous day high was 134.36 while the previous day low was 132.55. The daily 38.2% Fib levels comes at 133.67, expected to provide support. Similarly, the daily 61.8% fib level is at 133.24, expected to provide support.
Note the levels of interest below:
- Pivot support is noted at 132.99, 131.86, 131.17
- Pivot resistance is noted at 134.8, 135.48, 136.61
| Levels | Levels.1 |
|---|---|
| Previous Daily High | 134.36 |
| Previous Daily Low | 132.55 |
| Previous Weekly High | 132.91 |
| Previous Weekly Low | 129.81 |
| Previous Monthly High | 134.78 |
| Previous Monthly Low | 127.22 |
| Daily Fibonacci 38.2% | 133.67 |
| Daily Fibonacci 61.8% | 133.24 |
| Daily Pivot Point S1 | 132.99 |
| Daily Pivot Point S2 | 131.86 |
| Daily Pivot Point S3 | 131.17 |
| Daily Pivot Point R1 | 134.80 |
| Daily Pivot Point R2 | 135.48 |
| Daily Pivot Point R3 | 136.61 |
[/s2If]
Join Our Telegram Group
")


