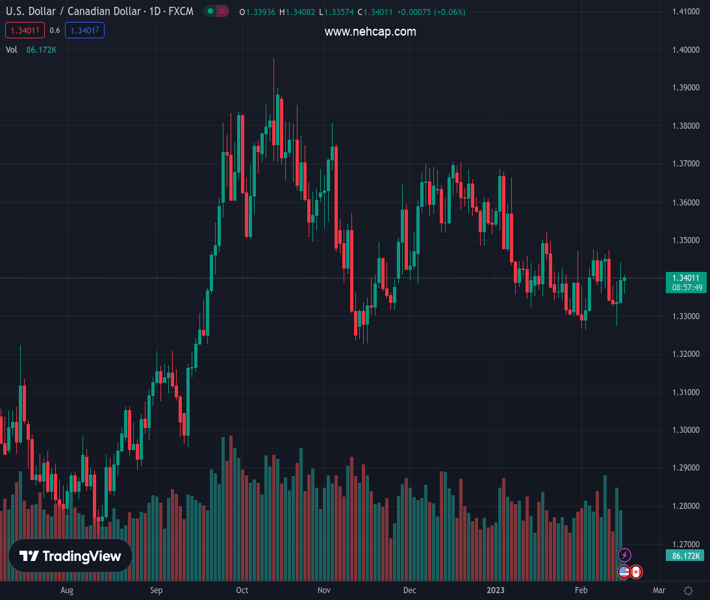
#USDCAD @ 1.34016 reverses an intrada dip and draws some support from a combination of factors. (Pivot Orderbook analysis)
…
This is a premium post.
[s2If !current_user_can(access_s2member_level4)]Please register for PREMIUM VERSION HERE to read full post below containing analysis. In case of any error or you think you are not able to read the full post below, please email us at support#nehcap.com [lwa][/s2If] [s2If current_user_can(access_s2member_level4)]
- USD/CAD reverses an intrada dip and draws some support from a combination of factors.
- Recession fears cap the attempted recovery in crude oil prices and undermine the Loonie.
- The USD trims a part of its intraday losses and further contributes to the intraday bounce.
The pair currently trades last at 1.34016.
The previous day high was 1.344 while the previous day low was 1.3333. The daily 38.2% Fib levels comes at 1.3399, expected to provide support. Similarly, the daily 61.8% fib level is at 1.3374, expected to provide support.
The USD/CAD pair attracts some buyers near the 1.3360-1.3355 region on Thursday and for now, seems to have stalled the pullback from the weekly high touched the previous day. The pair is currently placed just below the 1.3400 round-figure mark, nearly unchanged for the day, heading into the North American session.
Crude oil prices trim a part of the modest intraday gains amid worried that economic headwinds stemming from rising borrowing costs will dent fuel demand and undermines the commodity-linked Loonie. Apart from this, a combination of supporting factors assists the US Dollar to bounce off the daily low, which, in turn, acts as a tailwind for the USD/CAD pair.
Looming recession risks cap the recent optimistic move in the equity markets. Furthermore, expectations that the Fed will stick to its hawkish stance for longer, in the wake of stubbornly high inflation, lends some support to the safe-haven buck. In fact, the markets are now pricing in at least a 25 bps lift-off at the next two FOMC meetings in March and May.
The aforementioned fundamental backdrop seems tilted firmly in favour of the USD bulls and supports prospects for a further intraday move up for the USD/CAD pair. Hence, a subsequent strength towards the weekly high, around the 1.3440 area touched on Wednesday, looks like a distinct possibility. Traders now look to the US macro data for some meaningful impetus.
Thursday’s US economic docket features the release of the Producer Price Index (PPI), the Philly Fed Manufacturing Index, Weekly Initial Jobless Claims, Building Permits and Housing Starts. This, along with the US bond yields and the broader risk sentiment, will drive the USD demand. Apart from this, oil price dynamics should produce short-term opportunities around the USD/CAD pair.
Technical Levels: Supports and Resistances
USDCAD currently trading at 1.3397 at the time of writing. Pair opened at 1.3391 and is trading with a change of 0.04 % .
| Overview | Overview.1 | |
|---|---|---|
| 0 | Today last price | 1.3397 |
| 1 | Today Daily Change | 0.0006 |
| 2 | Today Daily Change % | 0.0400 |
| 3 | Today daily open | 1.3391 |
The pair is trading above its 20 Daily moving average @ 1.3374, below its 50 Daily moving average @ 1.3475 , below its 100 Daily moving average @ 1.3523 and above its 200 Daily moving average @ 1.3241
| Trends | Trends.1 | |
|---|---|---|
| 0 | Daily SMA20 | 1.3374 |
| 1 | Daily SMA50 | 1.3475 |
| 2 | Daily SMA100 | 1.3523 |
| 3 | Daily SMA200 | 1.3241 |
The previous day high was 1.344 while the previous day low was 1.3333. The daily 38.2% Fib levels comes at 1.3399, expected to provide support. Similarly, the daily 61.8% fib level is at 1.3374, expected to provide support.
Note the levels of interest below:
- Pivot support is noted at 1.3336, 1.3281, 1.3229
- Pivot resistance is noted at 1.3443, 1.3495, 1.355
| Levels | Levels.1 |
|---|---|
| Previous Daily High | 1.3440 |
| Previous Daily Low | 1.3333 |
| Previous Weekly High | 1.3476 |
| Previous Weekly Low | 1.3338 |
| Previous Monthly High | 1.3685 |
| Previous Monthly Low | 1.3300 |
| Daily Fibonacci 38.2% | 1.3399 |
| Daily Fibonacci 61.8% | 1.3374 |
| Daily Pivot Point S1 | 1.3336 |
| Daily Pivot Point S2 | 1.3281 |
| Daily Pivot Point S3 | 1.3229 |
| Daily Pivot Point R1 | 1.3443 |
| Daily Pivot Point R2 | 1.3495 |
| Daily Pivot Point R3 | 1.3550 |
[/s2If]
Join Our Telegram Group
")


