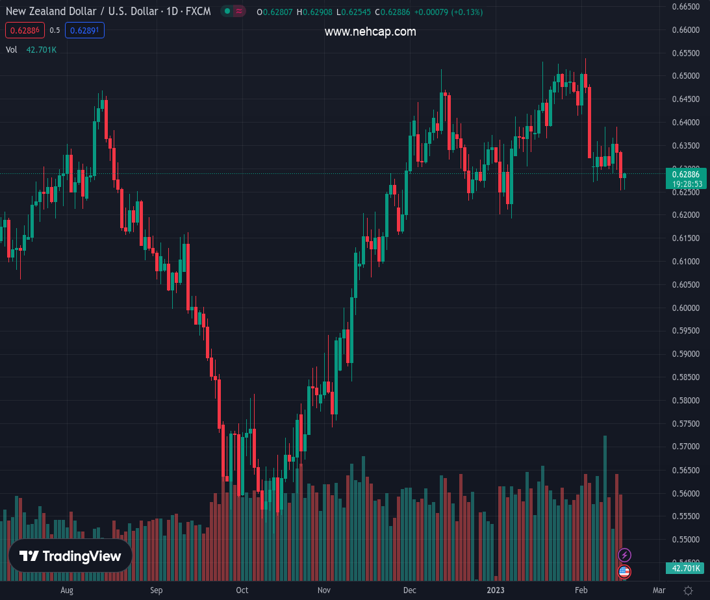
#NZDUSD @ 0.62869 picks up bids to probe two-day downtrend near six-week low., @nehcap view: Bearish (Pivot Orderbook analysis)
…
This is a premium post.
[s2If !current_user_can(access_s2member_level4)]Please register for PREMIUM VERSION HERE to read full post below containing analysis. In case of any error or you think you are not able to read the full post below, please email us at support#nehcap.com [lwa][/s2If] [s2If current_user_can(access_s2member_level4)]
- NZD/USD picks up bids to probe two-day downtrend near six-week low.
- Support-turned-resistance line from early January guards immediate upside.
- 200-SMA appears a tough nut to crack for bulls, sellers can aim for 2023 bottom.
- Downbeat oscillators, sustained trading below the key technical levels favor sellers.
The pair currently trades last at 0.62869.
The previous day high was 0.6342 while the previous day low was 0.6252. The daily 38.2% Fib levels comes at 0.6286, expected to provide support. Similarly, the daily 61.8% fib level is at 0.6308, expected to provide resistance.
NZD/USD renews intraday high near 0.6290 as it bounces off a 1.5-month low marked the previous day during Thursday’s mid-Asian session.
In doing so, the Kiwi pair takes clues from the nearly oversold RSI (14) to portray a corrective bounce after declining in the last two consecutive days, not to forget mentioning that it posted the biggest daily loss in two weeks on Wednesday.
It should, however, be noted that the recovery moves need to cross the six-week-old previous support line, now resistance around 0.6400, to convince intraday buyers.
Even so, a fortnight-old descending trend line and the 200-bar Simple Moving Average (SMA), respectively near 0.6365 and 0.6385 in that order, could challenge the pair’s further upside.
In a case where the NZD/USD pair remains firmer past 0.6385, the 0.6400 could act as a validation point for the rally targeting the monthly peak surrounding 0.6540.
On the contrary, pullback moves should break the 0.6250 horizontal support to recall the NZD/USD bears.
Following that, the previous monthly low of 0.6190 and late November 2022 bottom around 0.6155 will gain the pair seller’s attention.
Overall, NZD/USD is likely to remain bearish despite the latest rebound.
Trend: Bearish
Technical Levels: Supports and Resistances
NZDUSD currently trading at 0.6288 at the time of writing. Pair opened at 0.6287 and is trading with a change of 0.02% % .
| Overview | Overview.1 | |
|---|---|---|
| 0 | Today last price | 0.6288 |
| 1 | Today Daily Change | 0.0001 |
| 2 | Today Daily Change % | 0.02% |
| 3 | Today daily open | 0.6287 |
The pair is trading below its 20 Daily moving average @ 0.6405, below its 50 Daily moving average @ 0.6372 , above its 100 Daily moving average @ 0.6148 and above its 200 Daily moving average @ 0.6187
| Trends | Trends.1 | |
|---|---|---|
| 0 | Daily SMA20 | 0.6405 |
| 1 | Daily SMA50 | 0.6372 |
| 2 | Daily SMA100 | 0.6148 |
| 3 | Daily SMA200 | 0.6187 |
The previous day high was 0.6342 while the previous day low was 0.6252. The daily 38.2% Fib levels comes at 0.6286, expected to provide support. Similarly, the daily 61.8% fib level is at 0.6308, expected to provide resistance.
Note the levels of interest below:
- Pivot support is noted at 0.6245, 0.6204, 0.6155
- Pivot resistance is noted at 0.6335, 0.6384, 0.6425
| Levels | Levels.1 |
|---|---|
| Previous Daily High | 0.6342 |
| Previous Daily Low | 0.6252 |
| Previous Weekly High | 0.6391 |
| Previous Weekly Low | 0.6270 |
| Previous Monthly High | 0.6531 |
| Previous Monthly Low | 0.6190 |
| Daily Fibonacci 38.2% | 0.6286 |
| Daily Fibonacci 61.8% | 0.6308 |
| Daily Pivot Point S1 | 0.6245 |
| Daily Pivot Point S2 | 0.6204 |
| Daily Pivot Point S3 | 0.6155 |
| Daily Pivot Point R1 | 0.6335 |
| Daily Pivot Point R2 | 0.6384 |
| Daily Pivot Point R3 | 0.6425 |
[/s2If]
Join Our Telegram Group
")


