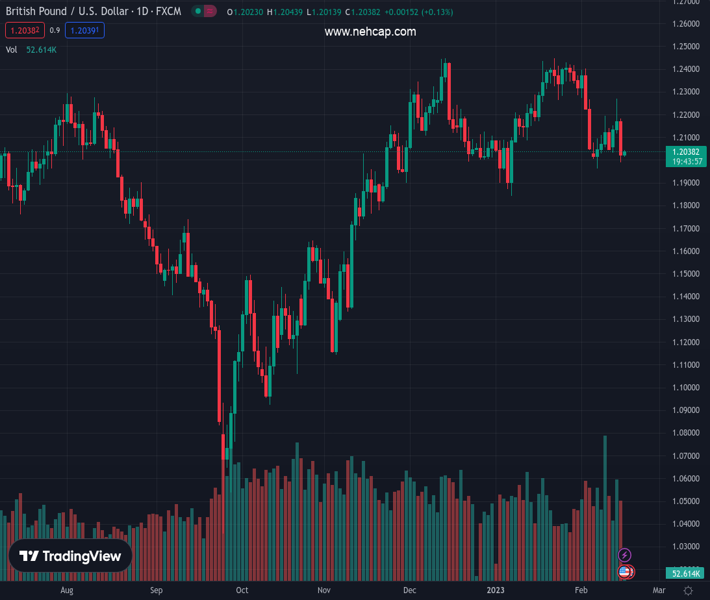
#GBPUSD @ 1.20384 grinds near intraday high as it consolidates the biggest daily loss in a fortnight. (Pivot Orderbook analysis)
…
This is a premium post.
[s2If !current_user_can(access_s2member_level4)]Please register for PREMIUM VERSION HERE to read full post below containing analysis. In case of any error or you think you are not able to read the full post below, please email us at support#nehcap.com [lwa][/s2If] [s2If current_user_can(access_s2member_level4)]
- GBP/USD grinds near intraday high as it consolidates the biggest daily loss in a fortnight.
- UK inflation, employment numbers raise doubts on BoE rate hike bias.
- US data propel hawkish Fed bets and propel yields, US Dollar.
- Mixed sentiment allowed Cable bears to take a breather ahead of second-tier US data, UK Retail Sales.
The pair currently trades last at 1.20384.
The previous day high was 1.2182 while the previous day low was 1.199. The daily 38.2% Fib levels comes at 1.2063, expected to provide resistance. Similarly, the daily 61.8% fib level is at 1.2108, expected to provide resistance.
GBP/USD seesaws around the intraday high of 1.2044 as it pares the previous day’s heavy losses during sluggish early hours of trading on Thursday. That said, the Cable pair dropped the most in a fortnight the previous day after the UK data poured cold water on the face of Bank of England (BoE) hawks. Also drowning the quote were upbeat US data that propelled the bets of higher Federal Reserve (Fed) interest rates.
In addition to the lack of major data/events, the risk-positive headlines from China and fears surrounding the US debt ceiling also seemed to have helped the GBP/USD pair in trimming the latest losses.
China President Xi Jinping recently crossed wires while showing readiness to deepen industrial and investment cooperation with Asia. “Willing to share ultra-large-scale markets, complete industrial systems and advanced technologies with central Asian countries,” said China’s Xi.
On the other hand, fears of witnessing the US debt-ceiling crisis, as warned by the US Congressional Budget Office (CBO) on Wednesday per Reuters, seem to probe the US Dollar bulls at the multi-day high and allow the GBP/USD to lick its wounds.
Amid these plays, the US Dollar Index (DXY) eases to 103.70, after rising to a fresh six-week high the previous day. Further, S&P 500 Futures rise 0.20% but whereas the US 10-year Treasury bond yields retreat following the run-up to a 1.5-month high marked on Wednesday.
On Wednesday, the UK Consumer Price Index (CPI) dropped to 10.1% YoY in January versus 10.3% market forecasts and 10.5% previous readings. With this, the headline inflation marks the third monthly decline after rising to the 41-year high in October. More importantly, the Core CPI, which excludes volatile food and energy items, slid to 5.8% on a yearly basis compared to the 6.2% expected and 6.3% in previous readings.
Alternatively, US Retail Sales growth jumped to 3.0% YoY in January versus 1.8% expected and -1.1% prior. Further, The Retail Sales ex-Autos grew by 2.3% in the same period, compared to analysts’ estimate of +0.8%. On the same line, the NY Empire State Manufacturing Index for February improved to a three-month high of -5.8 versus -18.0 expected and -32.9 market forecasts. Alternatively, the US Industrial Production marked 0.0% MoM figures for January, compared to analysts’ estimate of 0.5% and -0.7% previous readings, but failed to push back the hawkish bias surrounding the Federal Reserve’s (Fed) next move.
It should be noted that the market’s bets on the Fed’s next moves, as per the FEDWATCH tool of Reuters, suggest the US central bank’s benchmark rate is to peak in July around 5.25% versus the December Federal Reserve prediction of 5.10% top rate.
Moving on, a light calendar in the UK may allow GBP/USD to grind higher ahead of the US data concerning the housing market, industrial activity and producer prices. Following that, the UK Retail Sales for January, up for publishing on Thursday, will be eyed for clear directions.
GBP/USD rebounds from a six-week-old support line near 1. 2000. The recovery moves, however, remain elusive considering the quote’s sustained U-turn from the 50-DMA and the bearish MACD signals.
Technical Levels: Supports and Resistances
GBPUSD currently trading at 1.204 at the time of writing. Pair opened at 1.2034 and is trading with a change of 0.05 % .
| Overview | Overview.1 | |
|---|---|---|
| 0 | Today last price | 1.2040 |
| 1 | Today Daily Change | 0.0006 |
| 2 | Today Daily Change % | 0.0500 |
| 3 | Today daily open | 1.2034 |
The pair is trading below its 20 Daily moving average @ 1.2234, below its 50 Daily moving average @ 1.2183 , above its 100 Daily moving average @ 1.1885 and above its 200 Daily moving average @ 1.1942
| Trends | Trends.1 | |
|---|---|---|
| 0 | Daily SMA20 | 1.2234 |
| 1 | Daily SMA50 | 1.2183 |
| 2 | Daily SMA100 | 1.1885 |
| 3 | Daily SMA200 | 1.1942 |
The previous day high was 1.2182 while the previous day low was 1.199. The daily 38.2% Fib levels comes at 1.2063, expected to provide resistance. Similarly, the daily 61.8% fib level is at 1.2108, expected to provide resistance.
Note the levels of interest below:
- Pivot support is noted at 1.1955, 1.1876, 1.1762
- Pivot resistance is noted at 1.2147, 1.2261, 1.2339
| Levels | Levels.1 |
|---|---|
| Previous Daily High | 1.2182 |
| Previous Daily Low | 1.1990 |
| Previous Weekly High | 1.2194 |
| Previous Weekly Low | 1.1961 |
| Previous Monthly High | 1.2448 |
| Previous Monthly Low | 1.1841 |
| Daily Fibonacci 38.2% | 1.2063 |
| Daily Fibonacci 61.8% | 1.2108 |
| Daily Pivot Point S1 | 1.1955 |
| Daily Pivot Point S2 | 1.1876 |
| Daily Pivot Point S3 | 1.1762 |
| Daily Pivot Point R1 | 1.2147 |
| Daily Pivot Point R2 | 1.2261 |
| Daily Pivot Point R3 | 1.2339 |
[/s2If]
Join Our Telegram Group
")


