#EURUSD @ 1.07053 picks up bids to pare the previous day’s losses., @nehcap view: Further downside expected (Pivot Orderbook analysis)
…
This is a premium post.
[s2If !current_user_can(access_s2member_level4)]Please register for PREMIUM VERSION HERE to read full post below containing analysis. In case of any error or you think you are not able to read the full post below, please email us at support#nehcap.com [lwa][/s2If] [s2If current_user_can(access_s2member_level4)]
- EUR/USD picks up bids to pare the previous day’s losses.
- 50-day EMA probes bears on the way to January’s low.
- Clear U-turn from 21-day EMA, downside break of three-month-old ascending trend line favor sellers.
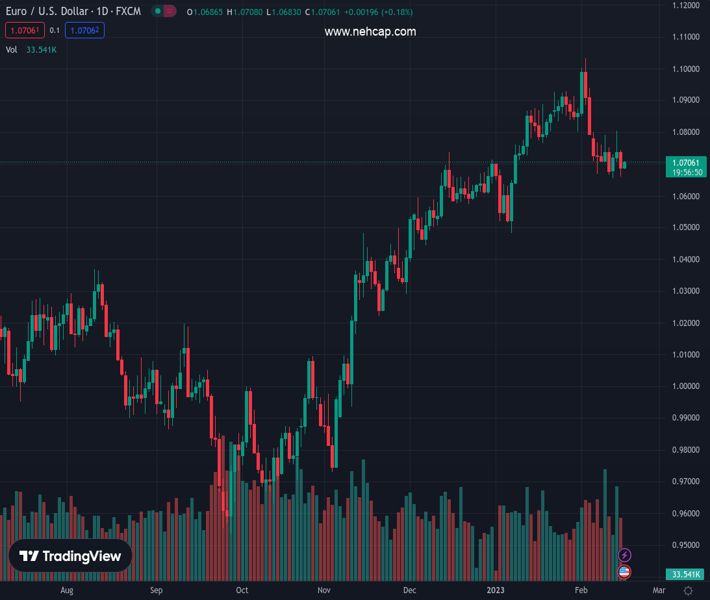
The pair currently trades last at 1.07053.
The previous day high was 1.0744 while the previous day low was 1.0661. The daily 38.2% Fib levels comes at 1.0693, expected to provide support. Similarly, the daily 61.8% fib level is at 1.0712, expected to provide resistance.
EUR/USD renews its intraday high near 1.0705 as it consolidates the previous day’s losses during early Thursday. In doing so, the major currency pair prints mild gains while bouncing off the 50-day Exponential Moving Average (EMA).
However, the quote’s sustained U-turn from the 21-day EMA, marked earlier in the week, joins the clear downside break of the previous support line from November to keep the bears hopeful. It’s worth noting that the bearish MACD signals and steady RSI (14) line also strengthen the downside bias.
As a result, the EUR/USD sellers remain hopeful despite the latest rebound from the short-term key EMA around 1.0680 by the press time. It should be noted that the weekly low surrounding 1.0655 adds to the downside filters.
That said, a successful break of the 1.0655 support could quickly drag the EUR/USD bears toward the previous monthly low near 1.0480. During the fall, the 1.0600 and the 1.0500 round figure may act as intermediate halts.
Meanwhile, the 21-day EMA level of 1.0758 guards the quote’s further recovery before highlighting the support-turned-resistance line from the last November, close to 1.0775 by the press time.
Following that, a two-week-old horizontal resistance near 1.0800-05 could act as the last defense of the EUR/USD bears.
Trend: Further downside expected
Technical Levels: Supports and Resistances
EURUSD currently trading at 1.0698 at the time of writing. Pair opened at 1.069 and is trading with a change of 0.07% % .
| Overview | Overview.1 | |
|---|---|---|
| 0 | Today last price | 1.0698 |
| 1 | Today Daily Change | 0.0008 |
| 2 | Today Daily Change % | 0.07% |
| 3 | Today daily open | 1.069 |
The pair is trading below its 20 Daily moving average @ 1.0813, below its 50 Daily moving average @ 1.072 , above its 100 Daily moving average @ 1.0395 and above its 200 Daily moving average @ 1.0326
| Trends | Trends.1 | |
|---|---|---|
| 0 | Daily SMA20 | 1.0813 |
| 1 | Daily SMA50 | 1.0720 |
| 2 | Daily SMA100 | 1.0395 |
| 3 | Daily SMA200 | 1.0326 |
The previous day high was 1.0744 while the previous day low was 1.0661. The daily 38.2% Fib levels comes at 1.0693, expected to provide support. Similarly, the daily 61.8% fib level is at 1.0712, expected to provide resistance.
Note the levels of interest below:
- Pivot support is noted at 1.0652, 1.0615, 1.0569
- Pivot resistance is noted at 1.0736, 1.0782, 1.082
| Levels | Levels.1 |
|---|---|
| Previous Daily High | 1.0744 |
| Previous Daily Low | 1.0661 |
| Previous Weekly High | 1.0799 |
| Previous Weekly Low | 1.0666 |
| Previous Monthly High | 1.0930 |
| Previous Monthly Low | 1.0483 |
| Daily Fibonacci 38.2% | 1.0693 |
| Daily Fibonacci 61.8% | 1.0712 |
| Daily Pivot Point S1 | 1.0652 |
| Daily Pivot Point S2 | 1.0615 |
| Daily Pivot Point S3 | 1.0569 |
| Daily Pivot Point R1 | 1.0736 |
| Daily Pivot Point R2 | 1.0782 |
| Daily Pivot Point R3 | 1.0820 |
[/s2If]
Join Our Telegram Group
")


