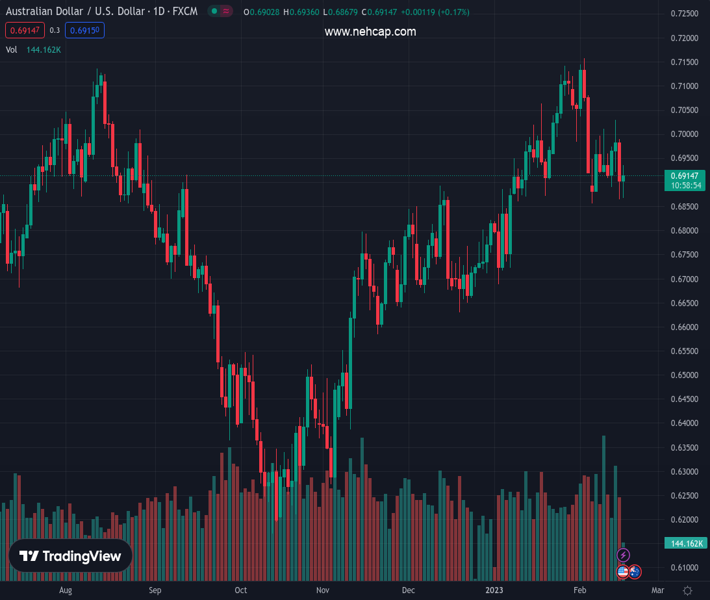
#AUDUSD @ 0.69158 attracts some dip-buying on Thursday despite disappointing Australian jobs data. (Pivot Orderbook analysis)
…
This is a premium post.
[s2If !current_user_can(access_s2member_level4)]Please register for PREMIUM VERSION HERE to read full post below containing analysis. In case of any error or you think you are not able to read the full post below, please email us at support#nehcap.com [lwa][/s2If] [s2If current_user_can(access_s2member_level4)]
- AUD/USD attracts some dip-buying on Thursday despite disappointing Australian jobs data.
- Retreating US bond yields triggers a modest USD pullback and lends support to the major.
- Hawkish Fed expectations should limit the USD losses and cap the pair ahead of the US data.
The pair currently trades last at 0.69158.
The previous day high was 0.6992 while the previous day low was 0.6865. The daily 38.2% Fib levels comes at 0.6913, expected to provide support. Similarly, the daily 61.8% fib level is at 0.6943, expected to provide resistance.
The AUD/USD pair once again show some resilience below the 50-day SMA and attracts fresh buying near the 0.6870-0.6865 region on Thursday. The pair sticks to its intraday gains through the first half of the European session and is currently placed around the 0.6920 region, just a few pips below the daily top.
As investors look past the downbeat Australian employment figures, a modest US Dollar weakness is seen as a key factor lending support to the AUD/USD pair. In fact, the Australian Bureau of Statistics reported earlier this Thursday that the number of employed people fell by 11.5K in January against an addition of 20K expected. Moreover, the previous month’s reading was also revised to show a loss of 19.9K jobs as compared to the 14.6 fall estimated originally. The unemployment rate, meanwhile, edged higher to 3.7% during the reported month vs. 3.5% anticipated and the previous.
The market reaction, however, turns out to be short-lived amid the emergence of some selling around the USD, which is weighed down by retreating US Treasury bond yields. That said, firming expectations for further policy tightening by the Federal Reserve should limit any meaningful downside for the US bond yields and the Greenback. Investors now seem convinced that the US central bank will stick to its hawkish stance for longer and are pricing in at least a 25 bps lift-off at the next two FOMC meetings in March and May. The bets were reaffirmed by the US consumer inflation figures on Tuesday.
Furthermore, Wednesday’s upbeat US monthly Retail Sales data pointed to a stronger economy, which remains resilient despite rising borrowing costs. This, along with the recent hawkish remarks by several Fed officials, stressing the need for additional interest rate hikes to fully gain control of inflation, favours the USD bulls. Apart from this, looming recession risks should also contribute to keeping a lid on any meaningful upside for the AUD/USD pair, at least for the time being. Traders now look forward to the US macro data for a fresh impetus during the early North American session.
Thursday’s US economic docket features the release of the Producer Price Index (PPI), the Philly Fed Manufacturing Index, the usual Weekly Initial Jobless Claims, Building Permits and Housing Starts. Apart from this, the US bond yields and the broader risk sentiment will influence the USD price dynamics. This, in turn, should allow traders to grab short-term opportunities around the AUD/USD pair.
Technical Levels: Supports and Resistances
AUDUSD currently trading at 0.6925 at the time of writing. Pair opened at 0.6908 and is trading with a change of 0.25 % .
| Overview | Overview.1 | |
|---|---|---|
| 0 | Today last price | 0.6925 |
| 1 | Today Daily Change | 0.0017 |
| 2 | Today Daily Change % | 0.2500 |
| 3 | Today daily open | 0.6908 |
The pair is trading below its 20 Daily moving average @ 0.7001, above its 50 Daily moving average @ 0.6884 , above its 100 Daily moving average @ 0.6699 and above its 200 Daily moving average @ 0.6806
| Trends | Trends.1 | |
|---|---|---|
| 0 | Daily SMA20 | 0.7001 |
| 1 | Daily SMA50 | 0.6884 |
| 2 | Daily SMA100 | 0.6699 |
| 3 | Daily SMA200 | 0.6806 |
The previous day high was 0.6992 while the previous day low was 0.6865. The daily 38.2% Fib levels comes at 0.6913, expected to provide support. Similarly, the daily 61.8% fib level is at 0.6943, expected to provide resistance.
Note the levels of interest below:
- Pivot support is noted at 0.6851, 0.6794, 0.6724
- Pivot resistance is noted at 0.6978, 0.7048, 0.7105
| Levels | Levels.1 |
|---|---|
| Previous Daily High | 0.6992 |
| Previous Daily Low | 0.6865 |
| Previous Weekly High | 0.7011 |
| Previous Weekly Low | 0.6856 |
| Previous Monthly High | 0.7143 |
| Previous Monthly Low | 0.6688 |
| Daily Fibonacci 38.2% | 0.6913 |
| Daily Fibonacci 61.8% | 0.6943 |
| Daily Pivot Point S1 | 0.6851 |
| Daily Pivot Point S2 | 0.6794 |
| Daily Pivot Point S3 | 0.6724 |
| Daily Pivot Point R1 | 0.6978 |
| Daily Pivot Point R2 | 0.7048 |
| Daily Pivot Point R3 | 0.7105 |
[/s2If]
Join Our Telegram Group
")


