#AUDUSD @ 0.69086 rebounds from 0.6865-70 support confluence to consolidate biggest daily loss in two weeks., @nehcap view: Limited recovery expected (Pivot Orderbook analysis)
…
This is a premium post.
[s2If !current_user_can(access_s2member_level4)]Please register for PREMIUM VERSION HERE to read full post below containing analysis. In case of any error or you think you are not able to read the full post below, please email us at support#nehcap.com [lwa][/s2If] [s2If current_user_can(access_s2member_level4)]
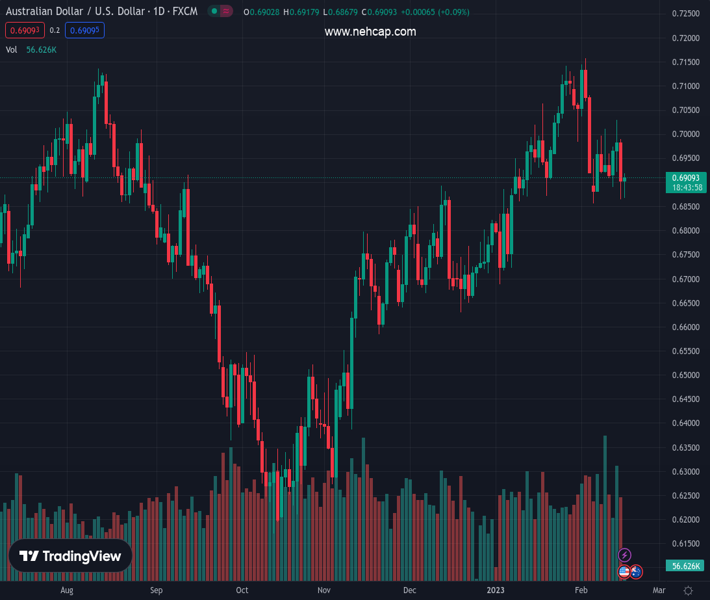
- AUD/USD rebounds from 0.6865-70 support confluence to consolidate biggest daily loss in two weeks.
- Convergence of head-and-shoulders’ neckline, two-month-old ascending trend line challenges bears.
- Buyers need validation from 21-DMA to retake control.
The pair currently trades last at 0.69086.
The previous day high was 0.6992 while the previous day low was 0.6865. The daily 38.2% Fib levels comes at 0.6913, expected to provide resistance. Similarly, the daily 61.8% fib level is at 0.6943, expected to provide resistance.
AUD/USD grinds near intraday high surrounding 0.6915 as it reverses the losses post Australian employment data release during early European morning on Thursday.
In doing so, the Aussie pair portrays a recovery move from the 0.6865-70 support confluence that encompasses the lower line of the six-week-old head-and-shoulders (H&S) bearish chart pattern and a two-month-old ascending trend line.
It’s worth noting, however, that the bearish MACD signals and the steady RSI (14) line join the Aussie pair’s sustained trading below the 21-DMA to challenge the bullish bias unless the quote rises past the immediate DMA hurdle surrounding the 0.7000 psychological magnet.
Even so, the weekly near 0.7030 and the monthly peak of 0.7157 could challenge the AUD/USD bulls afterward.
In a case where the AUD/USD buyers remain in the driver’s seat past 0.7157, the May 2022 high near 0.7285 will be on their radars.
On the contrary, a successful downside break of 0.6865 key support level is necessary for the Aussie pair bears to keep the reins.
Following that, the 200-DMA surrounding 0.6800 and the late 2022 low near 0.6630 may act as validation points during the theoretical south-run targeting the 0.6500 round figure.
Overall, AUD/USD remains bearish but the downside move needs validation from 0.6865.
Trend: Limited recovery expected
Technical Levels: Supports and Resistances
AUDUSD currently trading at 0.6916 at the time of writing. Pair opened at 0.6908 and is trading with a change of 0.12% % .
| Overview | Overview.1 | |
|---|---|---|
| 0 | Today last price | 0.6916 |
| 1 | Today Daily Change | 0.0008 |
| 2 | Today Daily Change % | 0.12% |
| 3 | Today daily open | 0.6908 |
The pair is trading below its 20 Daily moving average @ 0.7001, above its 50 Daily moving average @ 0.6884 , above its 100 Daily moving average @ 0.6699 and above its 200 Daily moving average @ 0.6806
| Trends | Trends.1 | |
|---|---|---|
| 0 | Daily SMA20 | 0.7001 |
| 1 | Daily SMA50 | 0.6884 |
| 2 | Daily SMA100 | 0.6699 |
| 3 | Daily SMA200 | 0.6806 |
The previous day high was 0.6992 while the previous day low was 0.6865. The daily 38.2% Fib levels comes at 0.6913, expected to provide resistance. Similarly, the daily 61.8% fib level is at 0.6943, expected to provide resistance.
Note the levels of interest below:
- Pivot support is noted at 0.6851, 0.6794, 0.6724
- Pivot resistance is noted at 0.6978, 0.7048, 0.7105
| Levels | Levels.1 |
|---|---|
| Previous Daily High | 0.6992 |
| Previous Daily Low | 0.6865 |
| Previous Weekly High | 0.7011 |
| Previous Weekly Low | 0.6856 |
| Previous Monthly High | 0.7143 |
| Previous Monthly Low | 0.6688 |
| Daily Fibonacci 38.2% | 0.6913 |
| Daily Fibonacci 61.8% | 0.6943 |
| Daily Pivot Point S1 | 0.6851 |
| Daily Pivot Point S2 | 0.6794 |
| Daily Pivot Point S3 | 0.6724 |
| Daily Pivot Point R1 | 0.6978 |
| Daily Pivot Point R2 | 0.7048 |
| Daily Pivot Point R3 | 0.7105 |
[/s2If]
Join Our Telegram Group
")


