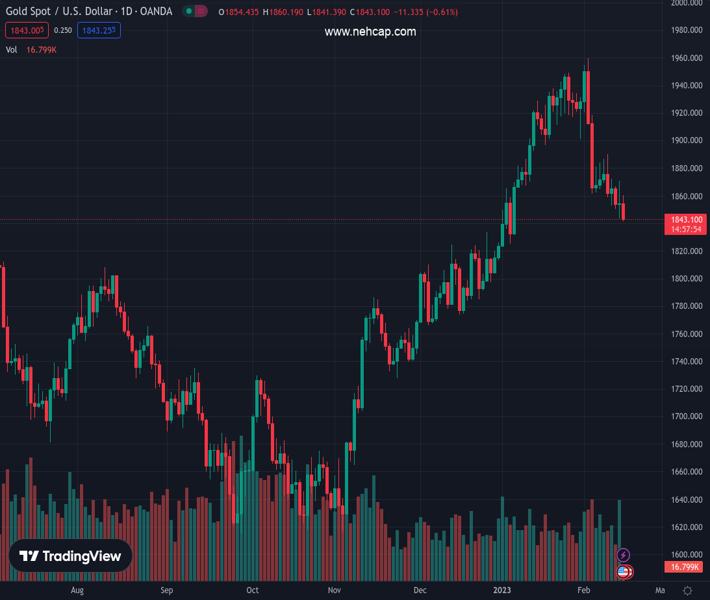
#XAUUSD @ 1,842.85 Gold price languishes near its lowest level since January amid sustained US Dollar buying. (Pivot Orderbook analysis)
…
This is a premium post.
[s2If !current_user_can(access_s2member_level4)]Please register for PREMIUM VERSION HERE to read full post below containing analysis. In case of any error or you think you are not able to read the full post below, please email us at support#nehcap.com [lwa][/s2If] [s2If current_user_can(access_s2member_level4)]
- Gold price languishes near its lowest level since January amid sustained US Dollar buying.
- Tuesday’s US CPI reaffirms Federal Reserve’s hawkish outlook and underpins the greenback.
- Recession fears weigh on investors’ sentiment and could lend some support to Gold price.
The pair currently trades last at 1842.85.
The previous day high was 1870.71 while the previous day low was 1843.33. The daily 38.2% Fib levels comes at 1860.25, expected to provide resistance. Similarly, the daily 61.8% fib level is at 1853.79, expected to provide resistance.
Gold price comes under some renewed selling pressure on Wednesday and remains on the defensive heading into the European session. The XAU/USD is currently placed just below the $1,845 level, flirting with its lowest level since January 6 touched in the last hour, and seems vulnerable to decline further.
The US Dollar (USD) stands tall near a multi-week high amid expectations that the Federal Reserve (Fed) will stick to its hawkish stance in the wake of stubbornly high inflation. This, in turn, is seen as a key factor driving flows away from the US Dollar-denominated Gold price. The market bets that interest rates are going to remain higher for longer were lifted by data, showing that the headline Consumer Price Index (CPI) in the United States (US) rose in line with expectations, by 0.5% in January. On an annualized basis, US CPI eased from 6.5% to 6.4% during the reported month, though remained above consensus estimates for a reading of 6.2%. More importantly, Core CPI which excludes food and energy prices, also came in higher-than-anticipated, at a 5.6% YoY rate.
Adding to this, FOMC members stressed the need to keep raising rates gradually to beat inflation. In fact, Richmond Fed President Thomas Barkin told Bloomberg TV that inflation is normalizing but it’s coming down slowly. If it persists at levels well above the target, the Fed will have to raise rates to a higher level than previously anticipated, Barkin added. Separately, Dallas Fed President Lorie Logan said, “we must remain prepared to continue rate increases for a longer period than anticipated.” Adding to this, New York Fed President John Williams flagged a prolonged battle against inflation over the coming months. The markets were quick to price in at least 25 bps lift-off at each of the next two Federal Open Market Committee (FOMC) meetings in March and in May.
This, in turn, pushes the US Treasury bond yields higher, which is seen as another factor benefitting the Greenback and exerting downward pressure on the non-yielding Gold price. That said, the recent yield curve inversion adds to worries about an impending recession and takes its toll on the global risk sentiment. The risk-off mood is evident from a generally weaker tone around the equity markets and could lend some support to the safe-haven precious metal, at least for now. Nevertheless, the fundamental backdrop seems tilted in favour of bearish traders and suggests that the path of least resistance for the XAU/USD is to the downside. Traders now look to the US economic docket, featuring monthly Retail Sales and the Empire State Manufacturing Index for a fresh impetus.
From a technical perspective, acceptance below the 50-day Simple Moving Average (SMA) adds credence to the negative outlook and supports prospects for deeper losses. Furthermore, oscillators on the daily chart are holding deep in the bearish territory and are still far from being in the oversold zone. Hence, a subsequent slide towards the $1,830 intermediate support, en route to the $1,818-$1,817 zone and the $1,800 round figure, looks like a distinct possibility.
On the flip side, the 50-day SMA, currently around the $1,858-$1,859 region, now seems to act as an immediate hurdle ahead of the overnight swing high, around the $1,870-$1,871 zone. Any further recovery might still be seen as a selling opportunity and runs the risk of fizzling out rather quickly near the $1,890 barrier. That said, some follow-through buying beyond the $1,900 mark could prompt some short-covering move and lift the Gold price to the next relevant resistance near the $1,925-$1,930 congestion zone.
Technical Levels: Supports and Resistances
XAUUSD currently trading at 1845.07 at the time of writing. Pair opened at 1856.06 and is trading with a change of -0.59 % .
| Overview | Overview.1 | |
|---|---|---|
| 0 | Today last price | 1845.07 |
| 1 | Today Daily Change | -10.99 |
| 2 | Today Daily Change % | -0.59 |
| 3 | Today daily open | 1856.06 |
The pair is trading below its 20 Daily moving average @ 1903.4, below its 50 Daily moving average @ 1859.07 , above its 100 Daily moving average @ 1781.14 and above its 200 Daily moving average @ 1775.9
| Trends | Trends.1 | |
|---|---|---|
| 0 | Daily SMA20 | 1903.40 |
| 1 | Daily SMA50 | 1859.07 |
| 2 | Daily SMA100 | 1781.14 |
| 3 | Daily SMA200 | 1775.90 |
The previous day high was 1870.71 while the previous day low was 1843.33. The daily 38.2% Fib levels comes at 1860.25, expected to provide resistance. Similarly, the daily 61.8% fib level is at 1853.79, expected to provide resistance.
Note the levels of interest below:
- Pivot support is noted at 1842.69, 1829.32, 1815.31
- Pivot resistance is noted at 1870.07, 1884.08, 1897.45
| Levels | Levels.1 |
|---|---|
| Previous Daily High | 1870.71 |
| Previous Daily Low | 1843.33 |
| Previous Weekly High | 1890.27 |
| Previous Weekly Low | 1852.84 |
| Previous Monthly High | 1949.27 |
| Previous Monthly Low | 1823.76 |
| Daily Fibonacci 38.2% | 1860.25 |
| Daily Fibonacci 61.8% | 1853.79 |
| Daily Pivot Point S1 | 1842.69 |
| Daily Pivot Point S2 | 1829.32 |
| Daily Pivot Point S3 | 1815.31 |
| Daily Pivot Point R1 | 1870.07 |
| Daily Pivot Point R2 | 1884.08 |
| Daily Pivot Point R3 | 1897.45 |
[/s2If]
Join Our Telegram Group
")


