WTI crude oil drops for the third consecutive day as risk-aversion joins fears of more supplies. (Pivot Orderbook analysis)
…
This is a premium post.
[s2If !current_user_can(access_s2member_level4)]Please register for PREMIUM VERSION HERE to read full post below containing analysis. In case of any error or you think you are not able to read the full post below, please email us at support#nehcap.com [lwa][/s2If] [s2If current_user_can(access_s2member_level4)]
- WTI crude oil drops for the third consecutive day as risk-aversion joins fears of more supplies.
- US SPR release, UAE Energy Minister’s comments join surprise inventory build to underpin higher supply hopes.
- Expectations of more energy demand, Russia-linked output cut challenge bears.
- US Dollar’s run-up amid hawkish Fed concerns exerts additional downside pressure on Oil price.
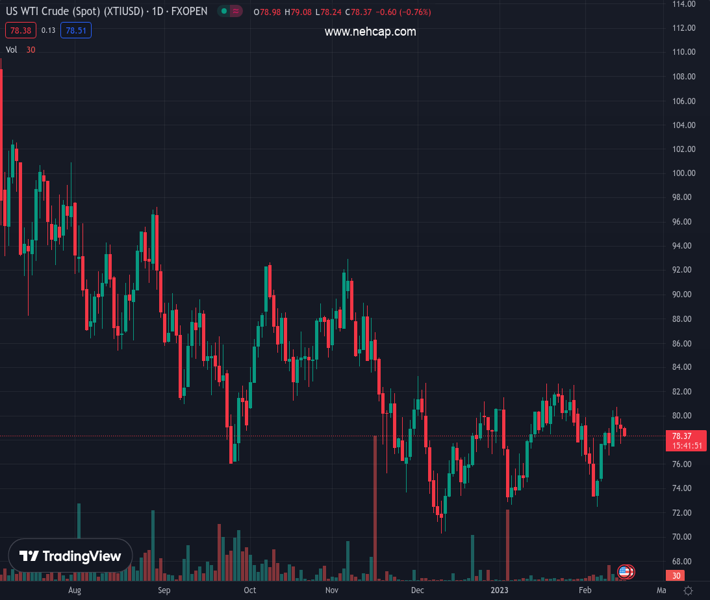
The pair currently trades last at 78.48.
The previous day high was 79.82 while the previous day low was 77.7. The daily 38.2% Fib levels comes at 78.51, expected to provide resistance. Similarly, the daily 61.8% fib level is at 79.01, expected to provide resistance.
WTI crude oil holds onto the week-start bearish bias as it renews its intraday low near $78.40 during early Wednesday morning in Europe. In doing so, the black gold bears the burden of the broad US Dollar recovery and downbeat sentiment amid expectations of more Oil supplies.
That said, UAE Energy Minister Suhail Mohamed Al Mazrouei mentioned on Tuesday that UAE is committed to the OPEC deal lasting until the end of 2023. The diplomat, however, stated that he is more worried about supply than demand for next year. While saying the same, UAE Energy Minister said, “The US Strategic Petroleum Reserve (SPR) release won’t shock the market.”
Although comments from the Arab official should have ideally put a floor under the prices, hawkish statements from the Federal Reserve (Fed) policymakers, despite unimpressive US inflation, joined a surprise build in US Oil inventories to weigh on prices.
On Tuesday, US Consumer Price Index (CPI) rose past market expectations to 6.4% YoY but posted the slowest increase since 2021 while easing below 6.5% prior. More importantly, CPI ex Food & Energy, better known as the Core CPI, grew 5.6% YoY compared to 5.5% market forecasts and the 5.7% previous readings. Following the data, Dallas Fed President Lorie Logan stated that they must remain prepared to continue rate increases for a longer period than previously anticipated. On the same line was New York Fed President John Williams who noted that the work to control too high inflation is not yet done. Additionally, Philadelphia Fed President Patrick Harker signaled that they are not done (with lifting rates), but they are likely close.
Elsewhere, the American Petroleum Institute (API) released its Weekly Crude Oil Stock until February 10 while noting an increase of 10.507 million barrels versus the previous draw of 2.184 million barrels.
It should be noted that the fears surrounding the global economic slowdown and the US readiness to keep using the SPR balance to battle the Russia-linked Oil shortage seem to have favored the black gold sellers. Alternatively, geopolitical fears and the OPEC+ output cut puts a floor under the energy benchmark’s price.
While portraying the mood, US 10-year Treasury bond yields retreat to around 3.74%, after rising three basis points (bps) to refresh a six-week high the previous day whereas the two-year counterpart jumped to the highest level since early November 2022 by poking 4.62%, near 4.61% at the latest. Further, S&P 500 Futures trace Wall Street’s downbeat closing to highlight the mildly offbeat mood and help the US Dollar Index (DXY) to extend the post-US CPI run-up to 103.45 by the press time.
Although failure to cross the 100-DMA recalled the WTI bears on Monday, the quote’s further downside appears elusive as it approaches the 50-DMA support, close to $77.70 by the press time.
Technical Levels: Supports and Resistances
XTIUSD currently trading at 78.48 at the time of writing. Pair opened at 79.37 and is trading with a change of -1.12% % .
| Overview | Overview.1 | |
|---|---|---|
| 0 | Today last price | 78.48 |
| 1 | Today Daily Change | -0.89 |
| 2 | Today Daily Change % | -1.12% |
| 3 | Today daily open | 79.37 |
The pair is trading below its 20 Daily moving average @ 78.82, above its 50 Daily moving average @ 77.61 , below its 100 Daily moving average @ 80.91 and below its 200 Daily moving average @ 89.86
| Trends | Trends.1 | |
|---|---|---|
| 0 | Daily SMA20 | 78.82 |
| 1 | Daily SMA50 | 77.61 |
| 2 | Daily SMA100 | 80.91 |
| 3 | Daily SMA200 | 89.86 |
The previous day high was 79.82 while the previous day low was 77.7. The daily 38.2% Fib levels comes at 78.51, expected to provide resistance. Similarly, the daily 61.8% fib level is at 79.01, expected to provide resistance.
Note the levels of interest below:
- Pivot support is noted at 78.11, 76.85, 76.0
- Pivot resistance is noted at 80.22, 81.07, 82.33
| Levels | Levels.1 |
|---|---|
| Previous Daily High | 79.82 |
| Previous Daily Low | 77.70 |
| Previous Weekly High | 80.48 |
| Previous Weekly Low | 72.50 |
| Previous Monthly High | 82.68 |
| Previous Monthly Low | 72.64 |
| Daily Fibonacci 38.2% | 78.51 |
| Daily Fibonacci 61.8% | 79.01 |
| Daily Pivot Point S1 | 78.11 |
| Daily Pivot Point S2 | 76.85 |
| Daily Pivot Point S3 | 76.00 |
| Daily Pivot Point R1 | 80.22 |
| Daily Pivot Point R2 | 81.07 |
| Daily Pivot Point R3 | 82.33 |
[/s2If]
Join Our Telegram Group
")


