#USDJPY @ 134.207 rallies above 134.00 after breaking above the 200-day EMA. (Pivot Orderbook analysis)
…
This is a premium post.
[s2If !current_user_can(access_s2member_level4)]Please register for PREMIUM VERSION HERE to read full post below containing analysis. In case of any error or you think you are not able to read the full post below, please email us at support#nehcap.com [lwa][/s2If] [s2If current_user_can(access_s2member_level4)]
- USD/JPY rallies above 134.00 after breaking above the 200-day EMA.
- USD/JPY Price Analysis: Upward biased, though a daily close above the 200-DMA could cement the uptrend.
The pair currently trades last at 134.207.
The previous day high was 133.32 while the previous day low was 131.5. The daily 38.2% Fib levels comes at 132.62, expected to provide support. Similarly, the daily 61.8% fib level is at 132.19, expected to provide support.
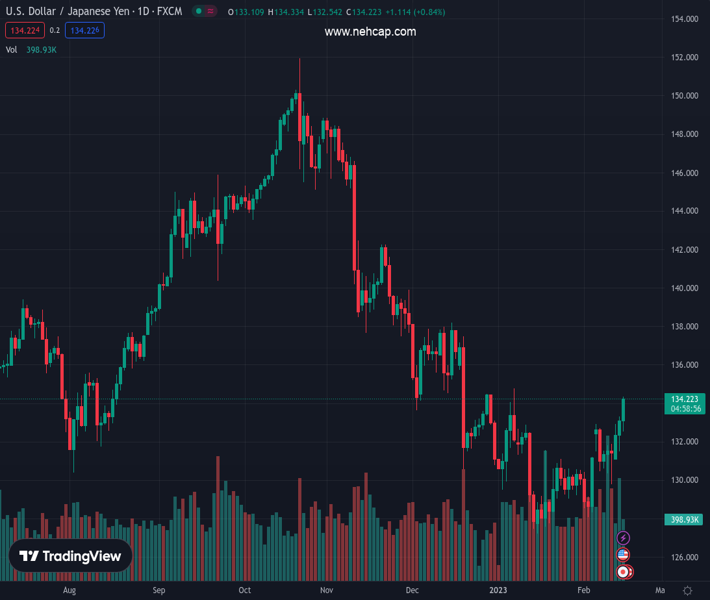
The USD/JPY rallies more than 100 pips and clears the 134.00 mark, breaking north of the 200-day Exponential Moving Average (EMA) at 133.77, a bullish/bearish bias measure for an asset. Hence, the USD/JPY shifted bullish during the session, though a daily close above the 200-day EMA would keep bulls hopeful for further upside. At the time of writing, the USD/JPY exchanges hand at 134.28 after hitting a low of 132.54.
From a daily chart perspective, the USD/JPY shifted upward biased after dropping from last year’s high of 151.94 towards the YTD low of 127.21 on January 16. Nevertheless, the USD/JPY needs to clear the confluence of the 100-day EMA and the YTD high at 134.77 to cement the uptrend.
The Relative Strength Index (RSI) and the Rate of Change (RoC) show that buyers are gathering momentum. Hence, the USD/JPY might test the 135.00 psychological level in the near term.
The USD/JPY 4-hour chart depicts the pair as bullish biased after breaking from the 131.70-133.00 consolidation range, eyeing to test the YTD high at 134.77. Even though the RSI shifted overbought, as long as it stays below 80, it portrays the USD/JPY in a strong uptrend. The RoC shows buyers are in control and might continue to ride the trend.
Therefore, the USD/JPY first resistance would be the YTD high at 134.77. A breach of the latter and the pair might get to 135.00, followed by 136.00, and then the December 19 daily high of 137.47.
Technical Levels: Supports and Resistances
USDJPY currently trading at 134.21 at the time of writing. Pair opened at 133.04 and is trading with a change of 0.88 % .
| Overview | Overview.1 | |
|---|---|---|
| 0 | Today last price | 134.21 |
| 1 | Today Daily Change | 1.17 |
| 2 | Today Daily Change % | 0.88 |
| 3 | Today daily open | 133.04 |
The pair is trading above its 20 Daily moving average @ 130.51, above its 50 Daily moving average @ 132.1 , below its 100 Daily moving average @ 137.96 and below its 200 Daily moving average @ 136.85
| Trends | Trends.1 | |
|---|---|---|
| 0 | Daily SMA20 | 130.51 |
| 1 | Daily SMA50 | 132.10 |
| 2 | Daily SMA100 | 137.96 |
| 3 | Daily SMA200 | 136.85 |
The previous day high was 133.32 while the previous day low was 131.5. The daily 38.2% Fib levels comes at 132.62, expected to provide support. Similarly, the daily 61.8% fib level is at 132.19, expected to provide support.
Note the levels of interest below:
- Pivot support is noted at 131.92, 130.8, 130.11
- Pivot resistance is noted at 133.74, 134.43, 135.55
| Levels | Levels.1 |
|---|---|
| Previous Daily High | 133.32 |
| Previous Daily Low | 131.50 |
| Previous Weekly High | 132.91 |
| Previous Weekly Low | 129.81 |
| Previous Monthly High | 134.78 |
| Previous Monthly Low | 127.22 |
| Daily Fibonacci 38.2% | 132.62 |
| Daily Fibonacci 61.8% | 132.19 |
| Daily Pivot Point S1 | 131.92 |
| Daily Pivot Point S2 | 130.80 |
| Daily Pivot Point S3 | 130.11 |
| Daily Pivot Point R1 | 133.74 |
| Daily Pivot Point R2 | 134.43 |
| Daily Pivot Point R3 | 135.55 |
[/s2If]
Join Our Telegram Group
")


