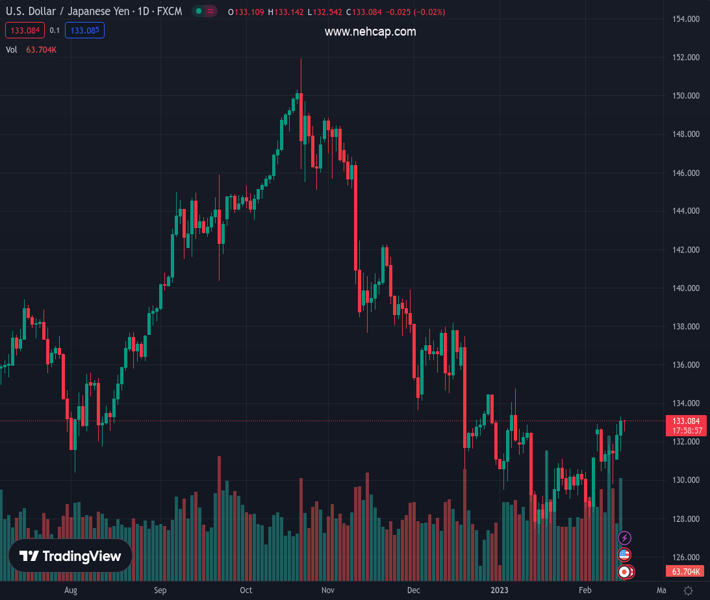
#USDJPY @ 133.044 is in the red for the first time this week, back below the 133.00 level. (Pivot Orderbook analysis)
…
This is a premium post.
[s2If !current_user_can(access_s2member_level4)]Please register for PREMIUM VERSION HERE to read full post below containing analysis. In case of any error or you think you are not able to read the full post below, please email us at support#nehcap.com [lwa][/s2If] [s2If current_user_can(access_s2member_level4)]
- USD/JPY is in the red for the first time this week, back below the 133.00 level.
- US Dollar benefits from risk aversion but US Treasury yields remain a drag.
- Bearish 50DMA support is in sight amid the pullback from multi-week highs.
The pair currently trades last at 133.044.
The previous day high was 133.32 while the previous day low was 131.5. The daily 38.2% Fib levels comes at 132.62, expected to provide support. Similarly, the daily 61.8% fib level is at 132.19, expected to provide support.
USD/JPY is on a corrective downside journey so far this Wednesday, witnessing losses for the first time this week. The pair is retreating from fresh six-week highs of 133.31 reached a day before, trading under 133.00 amid broad risk aversion.
Hotter-than-expected US Consumer Price Index (CPI) data combined with hawkish commentary from US Federal Reserve (Fed) officials have spooked investors, negatively impacting global stocks. The rush to safety in the US bond market is sending the US Treasury bond yields lower, in turn, weighing down on the USD/JPY pair.
Further, expectations that the new Bank of Japan (BoJ) Governor Kazuo Ueda could likely abandon the central bank’s yield curve policy are lending support to the Japanese Yen.
However, the renewed demand for the US Dollar, amid dominating risk-off flows, is fuelling the latest uptick in the spot. All eyes now turn toward the US Retail Sales data due later in the NA session for fresh trading impetus.
From a short-term technical perspective, USD/JPY is reattempting the 133.00 level, having found support near the 132.50 psychological level.
The 14-day Relative Strength Index (RSI) is edging higher above the midline, suggesting that the recovery momentum remains well in place.
Buyers need to take out the six-week high at 133.31 to extend the recent uptrend toward the static resistance at 133.50.
On the flip side, a sustained move below the 132.50 demand area will put the 50-Daily Moving Average (DMA) support at 132.03 under threat.
Technical Levels: Supports and Resistances
USDJPY currently trading at 132.91 at the time of writing. Pair opened at 133.04 and is trading with a change of -0.1 % .
| Overview | Overview.1 | |
|---|---|---|
| 0 | Today last price | 132.91 |
| 1 | Today Daily Change | -0.13 |
| 2 | Today Daily Change % | -0.10 |
| 3 | Today daily open | 133.04 |
The pair is trading above its 20 Daily moving average @ 130.51, above its 50 Daily moving average @ 132.1 , below its 100 Daily moving average @ 137.96 and below its 200 Daily moving average @ 136.85
| Trends | Trends.1 | |
|---|---|---|
| 0 | Daily SMA20 | 130.51 |
| 1 | Daily SMA50 | 132.10 |
| 2 | Daily SMA100 | 137.96 |
| 3 | Daily SMA200 | 136.85 |
The previous day high was 133.32 while the previous day low was 131.5. The daily 38.2% Fib levels comes at 132.62, expected to provide support. Similarly, the daily 61.8% fib level is at 132.19, expected to provide support.
Note the levels of interest below:
- Pivot support is noted at 131.92, 130.8, 130.11
- Pivot resistance is noted at 133.74, 134.43, 135.55
| Levels | Levels.1 |
|---|---|
| Previous Daily High | 133.32 |
| Previous Daily Low | 131.50 |
| Previous Weekly High | 132.91 |
| Previous Weekly Low | 129.81 |
| Previous Monthly High | 134.78 |
| Previous Monthly Low | 127.22 |
| Daily Fibonacci 38.2% | 132.62 |
| Daily Fibonacci 61.8% | 132.19 |
| Daily Pivot Point S1 | 131.92 |
| Daily Pivot Point S2 | 130.80 |
| Daily Pivot Point S3 | 130.11 |
| Daily Pivot Point R1 | 133.74 |
| Daily Pivot Point R2 | 134.43 |
| Daily Pivot Point R3 | 135.55 |
[/s2If]
Join Our Telegram Group
")


