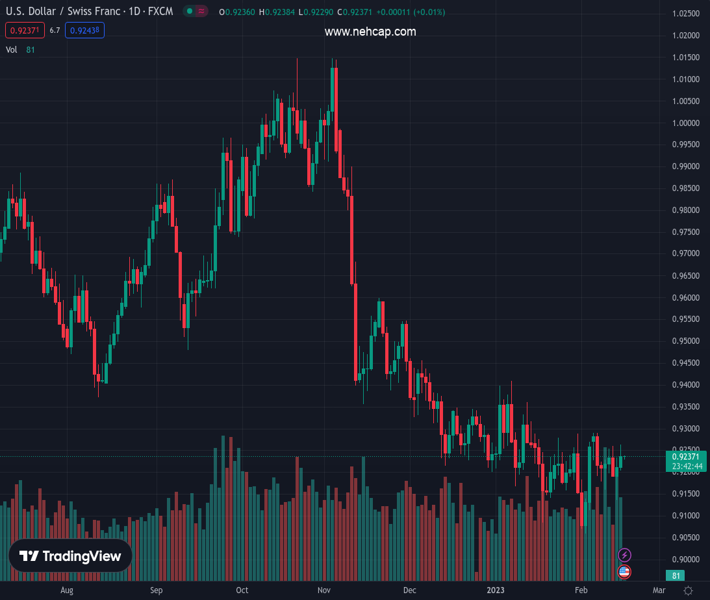
#USDCHF @ 0.92337 faced solid resistance at around 0.9260s, the top of a trading range. (Pivot Orderbook analysis)
…
This is a premium post.
[s2If !current_user_can(access_s2member_level4)]Please register for PREMIUM VERSION HERE to read full post below containing analysis. In case of any error or you think you are not able to read the full post below, please email us at support#nehcap.com [lwa][/s2If] [s2If current_user_can(access_s2member_level4)]
- USD/CHF faced solid resistance at around 0.9260s, the top of a trading range.
- The USD/CHF pair is neutral-downward biased from a daily chart perspective.
- In the short term, the USD/CHF might fall to the bottom of the range, below 0.9200.
The pair currently trades last at 0.92337.
The previous day high was 0.9234 while the previous day low was 0.9138. The daily 38.2% Fib levels comes at 0.9197, expected to provide support. Similarly, the daily 61.8% fib level is at 0.9175, expected to provide support.
The US Dollar (USD) continued to strengthen vs. the Swiss Franc (CHF) on Wednesday, bolstered by US economic data that supported speculations for further aggression by the Federal Reserve (Fed). Also, Fed officials’ hawkish commentary increased the likelihood of rates being hiked above the 5% threshold. Hence, the USD/CHF is trading at 0.9239 after hitting a daily low of 0.9209.
The USD/CHF pair daily chart portrays the major as neutral to downward biased, though it appears to have bottomed at around the YTD low at 0.9059, and since that day, the pair edged towards 0.9290. The USD/CHF traded sideways within the 0.9130-0.9260 range, unable to conquer the 0.9300 figure, which, once cleared, could open the door to test the long-term daily Exponential Moving Averages (EMAs) at around 0.9397, 0.9460.
In the short term, as shown by the 4-hour chart, the USD/CHF is range-bound, seesawing around the top of the range at 0.9260, with sellers leaning into that area. If the USD/CHF tumbles below the confluence of the 20/50-Exponential Moving Averages (EMAs) at 0.9214/21, that would send the USD/CHF pair sliding toward the 0.9200 figure before reaching the lows of February 14 at 0.9135. A decisive breach and the 0.9100 figure would be put into play.
Technical Levels: Supports and Resistances
USDCHF currently trading at 0.9238 at the time of writing. Pair opened at 0.9215 and is trading with a change of 0.25 % .
| Overview | Overview.1 | |
|---|---|---|
| 0 | Today last price | 0.9238 |
| 1 | Today Daily Change | 0.0023 |
| 2 | Today Daily Change % | 0.2500 |
| 3 | Today daily open | 0.9215 |
The pair is trading above its 20 Daily moving average @ 0.9202, below its 50 Daily moving average @ 0.9258 , below its 100 Daily moving average @ 0.951 and below its 200 Daily moving average @ 0.9598
| Trends | Trends.1 | |
|---|---|---|
| 0 | Daily SMA20 | 0.9202 |
| 1 | Daily SMA50 | 0.9258 |
| 2 | Daily SMA100 | 0.9510 |
| 3 | Daily SMA200 | 0.9598 |
The previous day high was 0.9234 while the previous day low was 0.9138. The daily 38.2% Fib levels comes at 0.9197, expected to provide support. Similarly, the daily 61.8% fib level is at 0.9175, expected to provide support.
Note the levels of interest below:
- Pivot support is noted at 0.9157, 0.9099, 0.9061
- Pivot resistance is noted at 0.9254, 0.9292, 0.935
| Levels | Levels.1 |
|---|---|
| Previous Daily High | 0.9234 |
| Previous Daily Low | 0.9138 |
| Previous Weekly High | 0.9291 |
| Previous Weekly Low | 0.9160 |
| Previous Monthly High | 0.9410 |
| Previous Monthly Low | 0.9085 |
| Daily Fibonacci 38.2% | 0.9197 |
| Daily Fibonacci 61.8% | 0.9175 |
| Daily Pivot Point S1 | 0.9157 |
| Daily Pivot Point S2 | 0.9099 |
| Daily Pivot Point S3 | 0.9061 |
| Daily Pivot Point R1 | 0.9254 |
| Daily Pivot Point R2 | 0.9292 |
| Daily Pivot Point R3 | 0.9350 |
[/s2If]
Join Our Telegram Group
")


