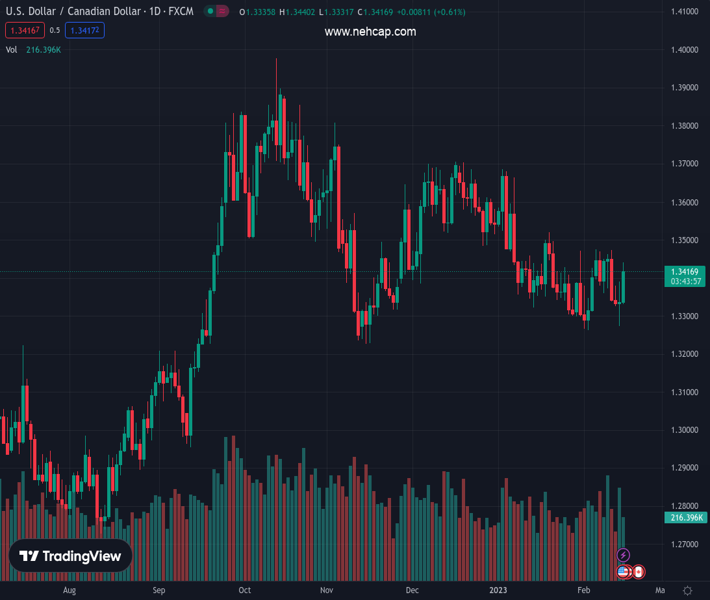
#USDCAD @ 1.34179 rallied above 1.3400 after solid US economic data, putting pressure on the Federal Reserve. (Pivot Orderbook analysis)
…
This is a premium post.
[s2If !current_user_can(access_s2member_level4)]Please register for PREMIUM VERSION HERE to read full post below containing analysis. In case of any error or you think you are not able to read the full post below, please email us at support#nehcap.com [lwa][/s2If] [s2If current_user_can(access_s2member_level4)]
- USD/CAD rallied above 1.3400 after solid US economic data, putting pressure on the Federal Reserve.
- January’s Retail Sales in the United States smashed estimates, backing up Fed officials’ hawkish comments.
- Money market futures are pricing in two 25 bps rate hikes by the US Federal Reserve.
The pair currently trades last at 1.34179.
The previous day high was 1.3391 while the previous day low was 1.3274. The daily 38.2% Fib levels comes at 1.3346, expected to provide support. Similarly, the daily 61.8% fib level is at 1.3319, expected to provide support.
USD/CAD is still upward biased after hitting a daily high of 1.3440, though it retreated some of its gains but remains above its opening price. Data from the United States (US) sparked speculation that the Federal Reserve (Fed) would continue to tighten policy, with forecasts eyeing the Fed Funds Rate (FFR) at around 5.10%. At the time of writing, the USD/CAD exchange hand sat 1.3422 after hitting a low of 1.3331.
A positive Retail Sales report from the United States (US) bolstered the US Dollar (USD) on speculations that the Fed is ways to go to tame elevated inflation. The US Commerce Department revealed that Retail Sales in January increased significantly by 3.0% compared to the previous month, which exceeded the 1.8% growth predicted by analysts. This surge in sales followed two consecutive months of decline. The primary factor contributing to the increase in sales is the tight labor market, which has led to substantial wage growth. Additionally, higher gasoline prices might have tilted sales up.
After the data release, US Treasury bond yields, namely the US 2-year note rate, the most sensitive to changes in interest rates, peaked around 4.703%, reflecting that traders expect at least two additional rate hikes, as shown by futures data. Money market futures estimate that the FFR would hit the 5.0%-5.25% range, meaning 25 bps in March and May meetings are foreseeable.
Hence, the USD/CAD edged toward its daily high at 1.3428 before reversing course below 1.3400. However, the London Fix gave USD/CAD bulls a fresh impulse, with them eyeing a break above the 50-day Exponential Moving Average (EMA) at 1.3429.
On the Canadian side, Housing Starts fell by 13% in January “from the previous month 215,365 dwellings, well below the 240,000 units that economists had expected,” according to Reuters. Even though Canadian bond yields increased, falling oil prices weighed on the Loonie (CAD).
Of late, Industrial Production (IP) in the US remained unchanged, as reported by the US Federal Reserve (Fed), while output was weaker than foreseen, spurred by higher borrowing costs in the manufacturing sector.
Technical Levels: Supports and Resistances
USDCAD currently trading at 1.3421 at the time of writing. Pair opened at 1.3338 and is trading with a change of 0.62 % .
| Overview | Overview.1 | |
|---|---|---|
| 0 | Today last price | 1.3421 |
| 1 | Today Daily Change | 0.0083 |
| 2 | Today Daily Change % | 0.6200 |
| 3 | Today daily open | 1.3338 |
The pair is trading above its 20 Daily moving average @ 1.3379, below its 50 Daily moving average @ 1.3481 , below its 100 Daily moving average @ 1.3525 and above its 200 Daily moving average @ 1.3239
| Trends | Trends.1 | |
|---|---|---|
| 0 | Daily SMA20 | 1.3379 |
| 1 | Daily SMA50 | 1.3481 |
| 2 | Daily SMA100 | 1.3525 |
| 3 | Daily SMA200 | 1.3239 |
The previous day high was 1.3391 while the previous day low was 1.3274. The daily 38.2% Fib levels comes at 1.3346, expected to provide support. Similarly, the daily 61.8% fib level is at 1.3319, expected to provide support.
Note the levels of interest below:
- Pivot support is noted at 1.3277, 1.3217, 1.316
- Pivot resistance is noted at 1.3394, 1.3451, 1.3511
| Levels | Levels.1 |
|---|---|
| Previous Daily High | 1.3391 |
| Previous Daily Low | 1.3274 |
| Previous Weekly High | 1.3476 |
| Previous Weekly Low | 1.3338 |
| Previous Monthly High | 1.3685 |
| Previous Monthly Low | 1.3300 |
| Daily Fibonacci 38.2% | 1.3346 |
| Daily Fibonacci 61.8% | 1.3319 |
| Daily Pivot Point S1 | 1.3277 |
| Daily Pivot Point S2 | 1.3217 |
| Daily Pivot Point S3 | 1.3160 |
| Daily Pivot Point R1 | 1.3394 |
| Daily Pivot Point R2 | 1.3451 |
| Daily Pivot Point R3 | 1.3511 |
[/s2If]
Join Our Telegram Group
")


