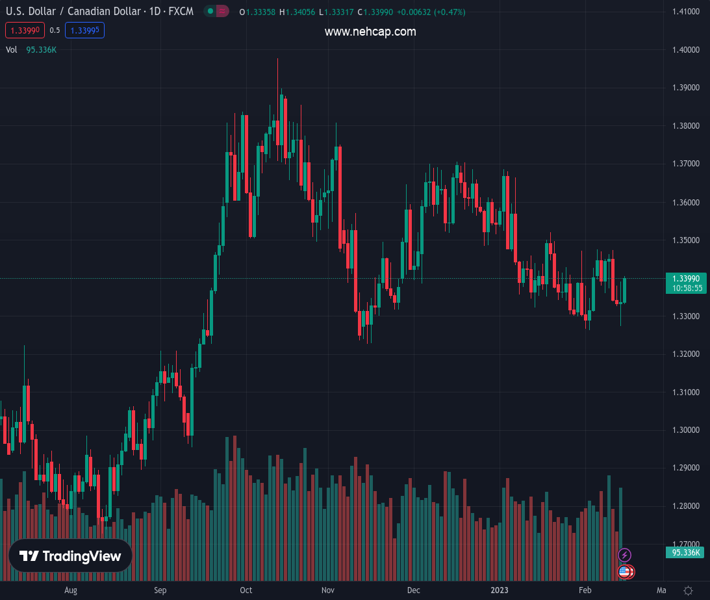
#USDCAD @ 1.34000 gains strong positive traction on Wednesday and climbs to a fresh weekly high. (Pivot Orderbook analysis)
…
This is a premium post.
[s2If !current_user_can(access_s2member_level4)]Please register for PREMIUM VERSION HERE to read full post below containing analysis. In case of any error or you think you are not able to read the full post below, please email us at support#nehcap.com [lwa][/s2If] [s2If current_user_can(access_s2member_level4)]
- USD/CAD gains strong positive traction on Wednesday and climbs to a fresh weekly high.
- Sliding crude oil prices undermine the Loonie and lend support amid sustained USD buying.
- A break through the trend-channel hurdle is needed to support prospects for additional gains.
The pair currently trades last at 1.34000.
The previous day high was 1.3391 while the previous day low was 1.3274. The daily 38.2% Fib levels comes at 1.3346, expected to provide support. Similarly, the daily 61.8% fib level is at 1.3319, expected to provide support.
The USD/CAD pair builds on the overnight late recovery from the 1.3275 area, or a one-and-half-week low and gains strong follow-through traction on Wednesday. Spot prices climb to a fresh weekly high during the first half of the European session, with bulls now looking to extend the momentum beyond the 1.3400 round-figure mark.
Crude oil prices prolong this week’s rejection slide from the 100-day SMA and remain depressed for the third successive day. This, in turn, undermines the commodity-linked Loonie. Apart from this, broad-based US Dollar strength, bolstered by expectations for additional rate hikes by the Fed and the risk-off mood, acts as a tailwind for the USD/CAD pair.
From a technical perspective, some follow-through buying above the 1.3430 area, or a resistance marked by the top end of over a two-month-old descending trend channel, will set the stage for further gains. The USD/CAD pair might then accelerate the momentum towards testing the 1.3470-1.3475 supply zone, which if cleared will mark a fresh bullish breakout.
The subsequent move-up should allow the USD/CAD pair to surpass the 1.3500 psychological mark and test the 100-day SMA, currently around the 1.3520 region. A sustained move beyond the latter could allow the bulls to reclaim the 1.3600 mark. The momentum could get extended to the 1.3645-1.3650 hurdle en route to the December swing high, around the 1.3700 round figure.
On the flip side, any meaningful pullback might now attract fresh buyers near the 1.3330 area. This is followed by the 1.3300 mark and the overnight swing low, around the 1.3275 region. Failure to defend the said support levels will make the USD/CAD pair vulnerable to weaken further towards the November 2022 swing low, around the 1.3230-1.3225 region.
Spot prices could eventually drop to the 1.3200 round figure and continue the downward trajectory towards challenging the descending channel support, currently near the 1.3125 zone.
Technical Levels: Supports and Resistances
USDCAD currently trading at 1.3402 at the time of writing. Pair opened at 1.3338 and is trading with a change of 0.48 % .
| Overview | Overview.1 | |
|---|---|---|
| 0 | Today last price | 1.3402 |
| 1 | Today Daily Change | 0.0064 |
| 2 | Today Daily Change % | 0.4800 |
| 3 | Today daily open | 1.3338 |
The pair is trading above its 20 Daily moving average @ 1.3379, below its 50 Daily moving average @ 1.3481 , below its 100 Daily moving average @ 1.3525 and above its 200 Daily moving average @ 1.3239
| Trends | Trends.1 | |
|---|---|---|
| 0 | Daily SMA20 | 1.3379 |
| 1 | Daily SMA50 | 1.3481 |
| 2 | Daily SMA100 | 1.3525 |
| 3 | Daily SMA200 | 1.3239 |
The previous day high was 1.3391 while the previous day low was 1.3274. The daily 38.2% Fib levels comes at 1.3346, expected to provide support. Similarly, the daily 61.8% fib level is at 1.3319, expected to provide support.
Note the levels of interest below:
- Pivot support is noted at 1.3277, 1.3217, 1.316
- Pivot resistance is noted at 1.3394, 1.3451, 1.3511
| Levels | Levels.1 |
|---|---|
| Previous Daily High | 1.3391 |
| Previous Daily Low | 1.3274 |
| Previous Weekly High | 1.3476 |
| Previous Weekly Low | 1.3338 |
| Previous Monthly High | 1.3685 |
| Previous Monthly Low | 1.3300 |
| Daily Fibonacci 38.2% | 1.3346 |
| Daily Fibonacci 61.8% | 1.3319 |
| Daily Pivot Point S1 | 1.3277 |
| Daily Pivot Point S2 | 1.3217 |
| Daily Pivot Point S3 | 1.3160 |
| Daily Pivot Point R1 | 1.3394 |
| Daily Pivot Point R2 | 1.3451 |
| Daily Pivot Point R3 | 1.3511 |
[/s2If]
Join Our Telegram Group
")


