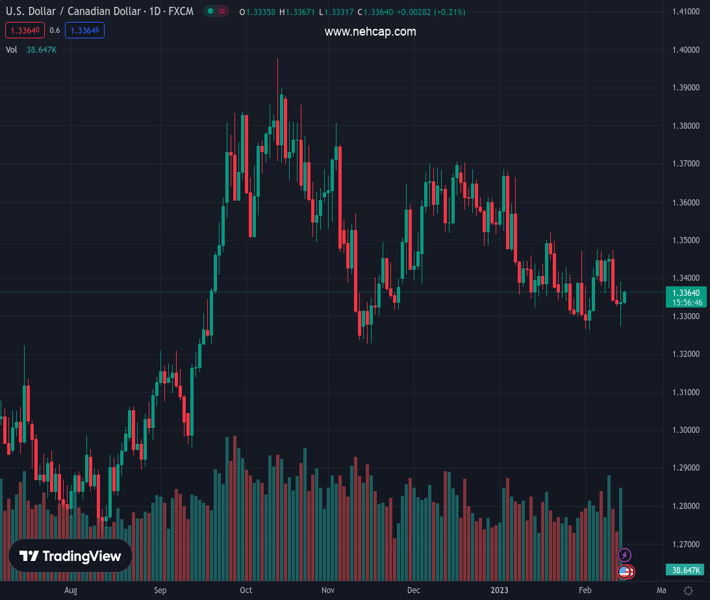
#USDCAD @ 1.33638 regains positive traction on Wednesday and is supported by a combination of factors. (Pivot Orderbook analysis)
…
This is a premium post.
[s2If !current_user_can(access_s2member_level4)]Please register for PREMIUM VERSION HERE to read full post below containing analysis. In case of any error or you think you are not able to read the full post below, please email us at support#nehcap.com [lwa][/s2If] [s2If current_user_can(access_s2member_level4)]
- USD/CAD regains positive traction on Wednesday and is supported by a combination of factors.
- Sliding crude oil prices undermines the Loonie and acts as a tailwind amid sustained USD buying.
- The prospects for more rate hikes by the Fed and the risk-off mood benefit the safe-haven buck.
The pair currently trades last at 1.33638.
The previous day high was 1.3391 while the previous day low was 1.3274. The daily 38.2% Fib levels comes at 1.3346, expected to provide support. Similarly, the daily 61.8% fib level is at 1.3319, expected to provide support.
The USD/CAD pair catches fresh bids on Wednesday following the previous day’s post-US CPI volatility and sticks to its intraday gains heading into the European session. The pair trades around the 1.3365 region, up nearly 0.25% for the day, and is supported by a combination of factors.
Weaker crude oil prices undermine the commodity-linked Loonie, which, along with broad-based US Dollar strength, acts as a tailwind for the USD/CAD pair. Investors now seem worried that economic headwinds stemming from rising borrowing costs will dent fuel demand. Apart from this, signs of another massive build in US crude inventories weigh on the black liquid. In fact, the American Petroleum Institute (API) report showed on Tuesday that US crude stockpiles grew over 10 million barrels in the week to February 10.
The USD, on the other hand, stands tall near a multi-week high amid firming expectations for further policy tightening by the Federal Reserve. In fact, the markets seen convinced that the US central bank will stick to its hawkish stance for longer in the wake of stubbornly high inflation. The bets were reaffirmed by the latest US CPI report released and hawkish commentary by several FOMC officials on Tuesday. This, along with the prevalent risk-off mood, benefits the safe-haven buck and lends support to the USD/CAD pair.
The aforementioned fundamental backdrop favours bullish traders and suggests that the path of least resistance for the USD/CAD pair is to the upside. Hence, some follow-through positive move, back towards reclaiming the 1.3400 round-figure mark, looks like a distinct possibility. The focus now shifts to the US economic docket, featuring the release of monthly Retail Sales and the Empire State Manufacturing Index. Traders will further take cues from oil price dynamics to grab short-term opportunities around the pair.
Technical Levels: Supports and Resistances
USDCAD currently trading at 1.3364 at the time of writing. Pair opened at 1.3338 and is trading with a change of 0.19 % .
| Overview | Overview.1 | |
|---|---|---|
| 0 | Today last price | 1.3364 |
| 1 | Today Daily Change | 0.0026 |
| 2 | Today Daily Change % | 0.1900 |
| 3 | Today daily open | 1.3338 |
The pair is trading below its 20 Daily moving average @ 1.3379, below its 50 Daily moving average @ 1.3481 , below its 100 Daily moving average @ 1.3525 and above its 200 Daily moving average @ 1.3239
| Trends | Trends.1 | |
|---|---|---|
| 0 | Daily SMA20 | 1.3379 |
| 1 | Daily SMA50 | 1.3481 |
| 2 | Daily SMA100 | 1.3525 |
| 3 | Daily SMA200 | 1.3239 |
The previous day high was 1.3391 while the previous day low was 1.3274. The daily 38.2% Fib levels comes at 1.3346, expected to provide support. Similarly, the daily 61.8% fib level is at 1.3319, expected to provide support.
Note the levels of interest below:
- Pivot support is noted at 1.3277, 1.3217, 1.316
- Pivot resistance is noted at 1.3394, 1.3451, 1.3511
| Levels | Levels.1 |
|---|---|
| Previous Daily High | 1.3391 |
| Previous Daily Low | 1.3274 |
| Previous Weekly High | 1.3476 |
| Previous Weekly Low | 1.3338 |
| Previous Monthly High | 1.3685 |
| Previous Monthly Low | 1.3300 |
| Daily Fibonacci 38.2% | 1.3346 |
| Daily Fibonacci 61.8% | 1.3319 |
| Daily Pivot Point S1 | 1.3277 |
| Daily Pivot Point S2 | 1.3217 |
| Daily Pivot Point S3 | 1.3160 |
| Daily Pivot Point R1 | 1.3394 |
| Daily Pivot Point R2 | 1.3451 |
| Daily Pivot Point R3 | 1.3511 |
[/s2If]
Join Our Telegram Group
")


