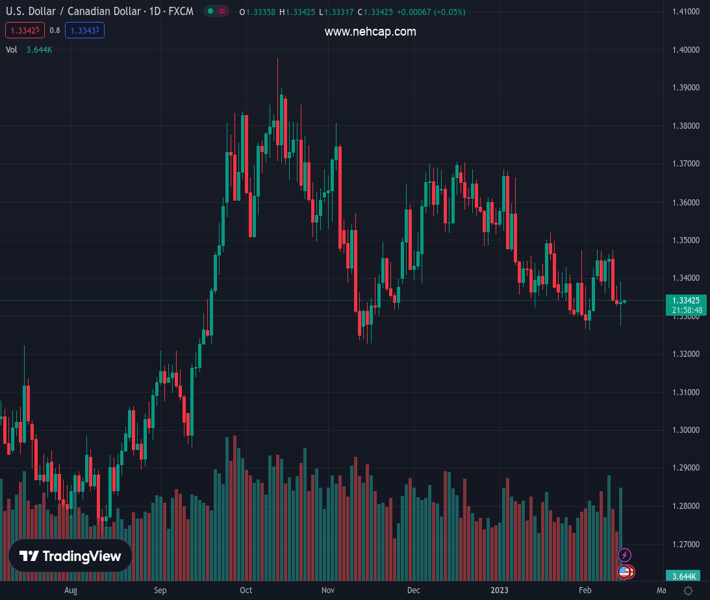
#USDCAD @ 1.33402 remains sidelined after reversing from two-week low., @nehcap view: Recovery expected (Pivot Orderbook analysis)
…
This is a premium post.
[s2If !current_user_can(access_s2member_level4)]Please register for PREMIUM VERSION HERE to read full post below containing analysis. In case of any error or you think you are not able to read the full post below, please email us at support#nehcap.com [lwa][/s2If] [s2If current_user_can(access_s2member_level4)]
- USD/CAD remains sidelined after reversing from two-week low.
- Bullish candlestick formation, clear bounce off 1.3270 support confluence lure buyers.
- November 2022 low adds to the downside filters.
The pair currently trades last at 1.33402.
The previous day high was 1.338 while the previous day low was 1.3325. The daily 38.2% Fib levels comes at 1.3346, expected to provide resistance. Similarly, the daily 61.8% fib level is at 1.3359, expected to provide resistance.
USD/CAD treads water around 1.3330 during early Wednesday, following a volatile day that initially refreshed two-week bottom before bouncing off the 1.3270 support confluence to end the day near 1.3337. In doing so, the Loonie pair portrayed a bullish Doji candlestick on Tuesday.
Not only the candlestick and the recovery from the convergence of the 200-day Exponential Moving Average (EMA) and a three-month-old ascending trend line but steady RSI (14) and a lack of bearish MACD signals also underpin the bullish bias for the USD/CAD pair.
That said, the 21-day EMA level surrounding 1.3385 guards immediate USD/CAD rebound ahead of the 1.3400 round figure and the monthly peak of near 1.3475.
Following that, a run-up towards the January 19 swing high of 1.3520 and then to the previous monthly high near 1.3685 can’t be ruled out.
On the flip side, the aforementioned support confluence challenges the USD/CAD bears around 1.3270, a break of which will need validation from the lows marked in February 2023 and November 2022, respectively near 1.3260 and 1.3225, to convince Loonie pair bears.
Even so, the 1.3200 threshold could act as the last defense of the pair buyers.
Overall, USD/CAD is up for a short-term rebound but the buyers seek validation from the 21-day EMA.
Trend: Recovery expected
Technical Levels: Supports and Resistances
USDCAD currently trading at 1.3338 at the time of writing. Pair opened at 1.3336 and is trading with a change of 0.01% % .
| Overview | Overview.1 | |
|---|---|---|
| 0 | Today last price | 1.3338 |
| 1 | Today Daily Change | 0.0002 |
| 2 | Today Daily Change % | 0.01% |
| 3 | Today daily open | 1.3336 |
The pair is trading below its 20 Daily moving average @ 1.3382, below its 50 Daily moving average @ 1.3487 , below its 100 Daily moving average @ 1.3529 and above its 200 Daily moving average @ 1.3238
| Trends | Trends.1 | |
|---|---|---|
| 0 | Daily SMA20 | 1.3382 |
| 1 | Daily SMA50 | 1.3487 |
| 2 | Daily SMA100 | 1.3529 |
| 3 | Daily SMA200 | 1.3238 |
The previous day high was 1.338 while the previous day low was 1.3325. The daily 38.2% Fib levels comes at 1.3346, expected to provide resistance. Similarly, the daily 61.8% fib level is at 1.3359, expected to provide resistance.
Note the levels of interest below:
- Pivot support is noted at 1.3314, 1.3292, 1.3259
- Pivot resistance is noted at 1.3369, 1.3402, 1.3424
| Levels | Levels.1 |
|---|---|
| Previous Daily High | 1.3380 |
| Previous Daily Low | 1.3325 |
| Previous Weekly High | 1.3476 |
| Previous Weekly Low | 1.3338 |
| Previous Monthly High | 1.3685 |
| Previous Monthly Low | 1.3300 |
| Daily Fibonacci 38.2% | 1.3346 |
| Daily Fibonacci 61.8% | 1.3359 |
| Daily Pivot Point S1 | 1.3314 |
| Daily Pivot Point S2 | 1.3292 |
| Daily Pivot Point S3 | 1.3259 |
| Daily Pivot Point R1 | 1.3369 |
| Daily Pivot Point R2 | 1.3402 |
| Daily Pivot Point R3 | 1.3424 |
[/s2If]
Join Our Telegram Group
")


