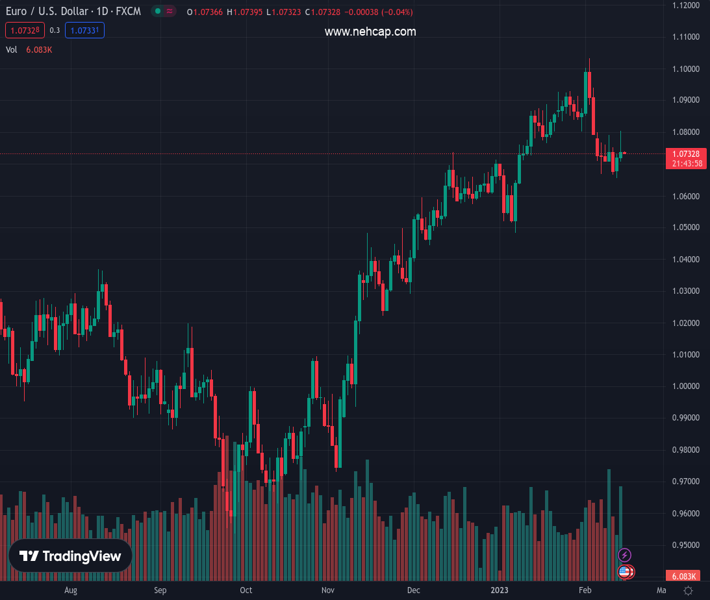
US Dollar Index probes two-day downtrend near the weekly bottom. (Pivot Orderbook analysis)
…
This is a premium post.
[s2If !current_user_can(access_s2member_level4)]Please register for PREMIUM VERSION HERE to read full post below containing analysis. In case of any error or you think you are not able to read the full post below, please email us at support#nehcap.com [lwa][/s2If] [s2If current_user_can(access_s2member_level4)]
- US Dollar Index probes two-day downtrend near the weekly bottom.
- Fed talks defend rate hike bias despite softer US inflation.
- Treasury yields renew multi-day high following the US CPI on upbeat Fed talks and propel DXY’s rebound.
- US Retail Sales, second-tier data eyed for fresh impulse.
The pair currently trades last at 103.25.
The previous day high was 103.52 while the previous day low was 102.54. The daily 38.2% Fib levels comes at 102.92, expected to provide support. Similarly, the daily 61.8% fib level is at 103.15, expected to provide support.
US Dollar Index (DXY) stays defensive around 103.30, following the bounce off a one-week low, as the greenback bulls await more clues to snap a two-day downtrend during early Wednesday.
The greenback’s gauge versus six major currencies dropped to the lowest level in a week the previous day as the US inflation data initially failed to impress US Dollar bulls. However, the hawkish Federal Reserve (Fed) comments propelled the US Treasury bond yield and the DXY afterward.
US Consumer Price Index (CPI) rose past market expectations to 6.4% YoY but posted the slowest increase since 2021 while easing below 6.5% prior. More importantly, CPI ex Food & Energy, better known as the Core CPI, grew 5.6% YoY compared to 5.5% market forecasts and the 5.7% previous readings.
Following the data, most of the Federal Reserve (Fed) policymakers were in favor of further rate hikes even as the United States inflation failed to match “positive surprise” hopes. The same propelled the US Treasury bond yields and US Dollar. That said, Dallas Fed President Lorie Logan stated that they must remain prepared to continue rate increases for a longer period than previously anticipated. On the same line was New York Fed President John Williams who noted that the work to control too high inflation is not yet done. Additionally, Philadelphia Fed President Patrick Harker signaled that they are not done (with lifting rates), but they are likely close.
As a result, US 10-year Treasury bond yields seesaw around 3.75%, up three basis points (bps) after refreshing a six-week high whereas the two-year counterpart jumped to the highest level since early November 2022 by poking 4.62%. The same joined day-end losses of Wall Street to underpin the DXY rebound.
However, the US Dollar Index traders should pay attention to Wednesday’s US Retail Sales and Industrial Production details for January, as well as NY Empire State Manufacturing Index for February, to confirm the hawkish Fed bias and keep the recovery moves intact.
Unless providing a successful daily close beyond the 50-DMA, around 103.40 by the press time, the US Dollar Index remains on the bear’s radar and can keep poking the 21-DMA support, close to 102.50 at the latest.
Technical Levels: Supports and Resistances
EURUSD currently trading at 103.25 at the time of writing. Pair opened at 103.25 and is trading with a change of 0.00% % .
| Overview | Overview.1 | |
|---|---|---|
| 0 | Today last price | 103.25 |
| 1 | Today Daily Change | 0.00 |
| 2 | Today Daily Change % | 0.00% |
| 3 | Today daily open | 103.25 |
The pair is trading above its 20 Daily moving average @ 102.49, below its 50 Daily moving average @ 103.39 , below its 100 Daily moving average @ 105.88 and below its 200 Daily moving average @ 106.73
| Trends | Trends.1 | |
|---|---|---|
| 0 | Daily SMA20 | 102.49 |
| 1 | Daily SMA50 | 103.39 |
| 2 | Daily SMA100 | 105.88 |
| 3 | Daily SMA200 | 106.73 |
The previous day high was 103.52 while the previous day low was 102.54. The daily 38.2% Fib levels comes at 102.92, expected to provide support. Similarly, the daily 61.8% fib level is at 103.15, expected to provide support.
Note the levels of interest below:
- Pivot support is noted at 102.69, 102.13, 101.72
- Pivot resistance is noted at 103.67, 104.08, 104.64
| Levels | Levels.1 |
|---|---|
| Previous Daily High | 103.52 |
| Previous Daily Low | 102.54 |
| Previous Weekly High | 103.96 |
| Previous Weekly Low | 102.64 |
| Previous Monthly High | 105.63 |
| Previous Monthly Low | 101.50 |
| Daily Fibonacci 38.2% | 102.92 |
| Daily Fibonacci 61.8% | 103.15 |
| Daily Pivot Point S1 | 102.69 |
| Daily Pivot Point S2 | 102.13 |
| Daily Pivot Point S3 | 101.72 |
| Daily Pivot Point R1 | 103.67 |
| Daily Pivot Point R2 | 104.08 |
| Daily Pivot Point R3 | 104.64 |
[/s2If]
Join Our Telegram Group
")


