#NZDUSD @ 0.63073 marks the second defeat from 50-DMA, renews intraday low., @nehcap view: Further downside expected (Pivot Orderbook analysis)
…
This is a premium post.
[s2If !current_user_can(access_s2member_level4)]Please register for PREMIUM VERSION HERE to read full post below containing analysis. In case of any error or you think you are not able to read the full post below, please email us at support#nehcap.com [lwa][/s2If] [s2If current_user_can(access_s2member_level4)]
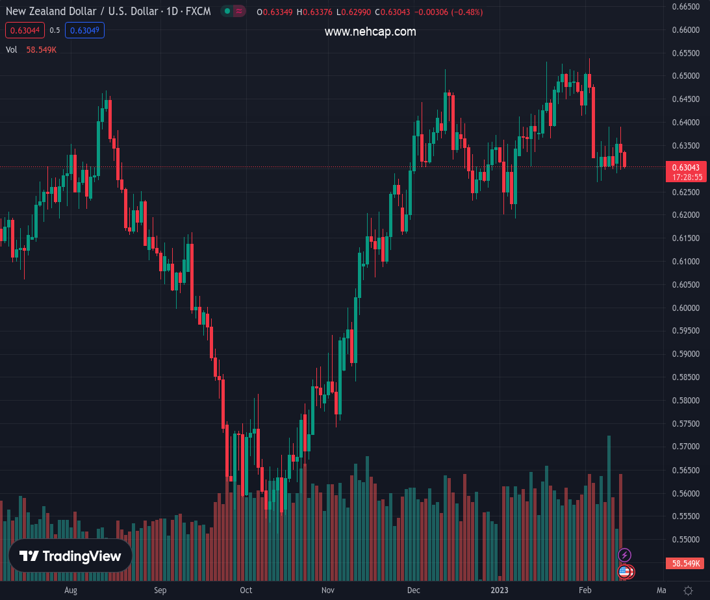
- NZD/USD marks the second defeat from 50-DMA, renews intraday low.
- Three-month-old rising wedge restricts downside ahead of 200-DMA.
- Bearish MACD signals, downbeat RSI and failure to cross 50-DMA favor sellers.
The pair currently trades last at 0.63073.
The previous day high was 0.6391 while the previous day low was 0.6297. The daily 38.2% Fib levels comes at 0.6333, expected to provide resistance. Similarly, the daily 61.8% fib level is at 0.6355, expected to provide resistance.
NZD/USD takes offers to refresh the intraday low near 0.6300 as it extends the previous day’s pullback from the 50-DMA hurdle during early Wednesday.
In doing so, the Kiwi pair marks the second such failure to cross the key Daily Moving Average (DMA) while staying inside a three-month-old rising wedge bearish chart formation.
Other than the failure to cross the 50-DMA, bearish MACD signals join the downbeat RSI (14), not oversold, to keep the bears hopeful.
However, a clear downside break of the three-month-old ascending support line, forming part of the stated rising wedge bearish chart formation, near 0.6290, becomes necessary.
Following that, the 200-DMA support surrounding 0.6180 and the mid-November 2022 swing low around 0.6065, could act as the last defense before directing the Kiwi pair toward the theoretical target of 0.5810. During the fall, the 0.6000 round figure may act as an extra filter towards the north.
Alternatively, a daily closing beyond the 50-DMA hurdle surrounding 0.6375 could aim for the 0.6400 threshold and the stated wedge’s top line near 0.6540. Though, any further upside appears less lucrative unless crossing the June 2022 high of near 0.6575.
Trend: Further downside expected
Technical Levels: Supports and Resistances
NZDUSD currently trading at 0.6301 at the time of writing. Pair opened at 0.634 and is trading with a change of -0.62% % .
| Overview | Overview.1 | |
|---|---|---|
| 0 | Today last price | 0.6301 |
| 1 | Today Daily Change | -0.0039 |
| 2 | Today Daily Change % | -0.62% |
| 3 | Today daily open | 0.634 |
The pair is trading below its 20 Daily moving average @ 0.6412, below its 50 Daily moving average @ 0.6374 , above its 100 Daily moving average @ 0.6143 and above its 200 Daily moving average @ 0.6187
| Trends | Trends.1 | |
|---|---|---|
| 0 | Daily SMA20 | 0.6412 |
| 1 | Daily SMA50 | 0.6374 |
| 2 | Daily SMA100 | 0.6143 |
| 3 | Daily SMA200 | 0.6187 |
The previous day high was 0.6391 while the previous day low was 0.6297. The daily 38.2% Fib levels comes at 0.6333, expected to provide resistance. Similarly, the daily 61.8% fib level is at 0.6355, expected to provide resistance.
Note the levels of interest below:
- Pivot support is noted at 0.6294, 0.6249, 0.6201
- Pivot resistance is noted at 0.6388, 0.6436, 0.6482
| Levels | Levels.1 |
|---|---|
| Previous Daily High | 0.6391 |
| Previous Daily Low | 0.6297 |
| Previous Weekly High | 0.6391 |
| Previous Weekly Low | 0.6270 |
| Previous Monthly High | 0.6531 |
| Previous Monthly Low | 0.6190 |
| Daily Fibonacci 38.2% | 0.6333 |
| Daily Fibonacci 61.8% | 0.6355 |
| Daily Pivot Point S1 | 0.6294 |
| Daily Pivot Point S2 | 0.6249 |
| Daily Pivot Point S3 | 0.6201 |
| Daily Pivot Point R1 | 0.6388 |
| Daily Pivot Point R2 | 0.6436 |
| Daily Pivot Point R3 | 0.6482 |
[/s2If]
Join Our Telegram Group
")


