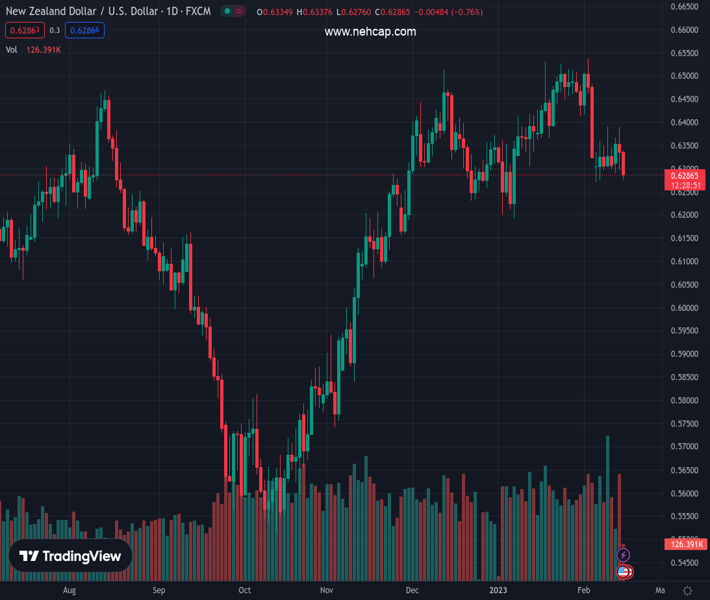
#NZDUSD @ 0.62844 remains under heavy selling pressure for the second successive day on Wednesday. (Pivot Orderbook analysis)
…
This is a premium post.
[s2If !current_user_can(access_s2member_level4)]Please register for PREMIUM VERSION HERE to read full post below containing analysis. In case of any error or you think you are not able to read the full post below, please email us at support#nehcap.com [lwa][/s2If] [s2If current_user_can(access_s2member_level4)]
- NZD/USD remains under heavy selling pressure for the second successive day on Wednesday.
- Spot prices drop closer to the monthly low amid strong follow-through buying around the USD.
- Expectations for additional rate hikes by the Fed and the risk-off mood benefit the greenback.
The pair currently trades last at 0.62844.
The previous day high was 0.6391 while the previous day low was 0.6297. The daily 38.2% Fib levels comes at 0.6333, expected to provide resistance. Similarly, the daily 61.8% fib level is at 0.6355, expected to provide resistance.
The NZD/USD pair extends the overnight late pullback from the vicinity of the 0.6400 mark, or a nearly two-week high and remains under heavy selling pressure for the second straight day on Wednesday. The pair drops closer to the monthly low, around the 0.6275 region, during the first half of the European session and is weighed down by strong follow-through buying around the US Dollar.
In fact, the USD Index, which tracks the Greenback against a basket of currencies, stands tall near a multi-week top amid the prospects for further policy tightening by the Federal Reserve. Investors seem convinced that the US central bank will stick to its hawkish stance for longer and The bets were lifted by a stronger US CPI report on Tuesday. Adding to this, several FOMC members stressed the need to keep raising rates gradually to fully gain control of inflation.
The markets were quick to start pricing in at least by 25 bps lift-off at each of the next two FOMC policy meetings in March and in May. Apart from this, the prevalent risk-off environment – as depicted by a generally weaker tone around the equity markets – further benefits the safe-haven buck and exerts additional pressure on the risk-sensitive Kiwi. Investors remain concerned about economic headwinds stemming from the continuous rise in borrowing costs.
Furthermore, the recent yield curve inversion adds to worries about an impending recession and takes its toll on the global risk sentiment. This, in turn, suggests that the path of least resistance for the NZD/USD pair is to the downside and any attempted recovery is more likely to attract fresh sellers at higher levels. Traders now look to the US economic docket, featuring monthly Retail Sales and the Empire State Manufacturing Index, for a fresh impetus.
Technical Levels: Supports and Resistances
NZDUSD currently trading at 0.6291 at the time of writing. Pair opened at 0.634 and is trading with a change of -0.77 % .
| Overview | Overview.1 | |
|---|---|---|
| 0 | Today last price | 0.6291 |
| 1 | Today Daily Change | -0.0049 |
| 2 | Today Daily Change % | -0.7700 |
| 3 | Today daily open | 0.6340 |
The pair is trading below its 20 Daily moving average @ 0.6412, below its 50 Daily moving average @ 0.6374 , above its 100 Daily moving average @ 0.6143 and above its 200 Daily moving average @ 0.6187
| Trends | Trends.1 | |
|---|---|---|
| 0 | Daily SMA20 | 0.6412 |
| 1 | Daily SMA50 | 0.6374 |
| 2 | Daily SMA100 | 0.6143 |
| 3 | Daily SMA200 | 0.6187 |
The previous day high was 0.6391 while the previous day low was 0.6297. The daily 38.2% Fib levels comes at 0.6333, expected to provide resistance. Similarly, the daily 61.8% fib level is at 0.6355, expected to provide resistance.
Note the levels of interest below:
- Pivot support is noted at 0.6294, 0.6249, 0.6201
- Pivot resistance is noted at 0.6388, 0.6436, 0.6482
| Levels | Levels.1 |
|---|---|
| Previous Daily High | 0.6391 |
| Previous Daily Low | 0.6297 |
| Previous Weekly High | 0.6391 |
| Previous Weekly Low | 0.6270 |
| Previous Monthly High | 0.6531 |
| Previous Monthly Low | 0.6190 |
| Daily Fibonacci 38.2% | 0.6333 |
| Daily Fibonacci 61.8% | 0.6355 |
| Daily Pivot Point S1 | 0.6294 |
| Daily Pivot Point S2 | 0.6249 |
| Daily Pivot Point S3 | 0.6201 |
| Daily Pivot Point R1 | 0.6388 |
| Daily Pivot Point R2 | 0.6436 |
| Daily Pivot Point R3 | 0.6482 |
[/s2If]
Join Our Telegram Group
")


