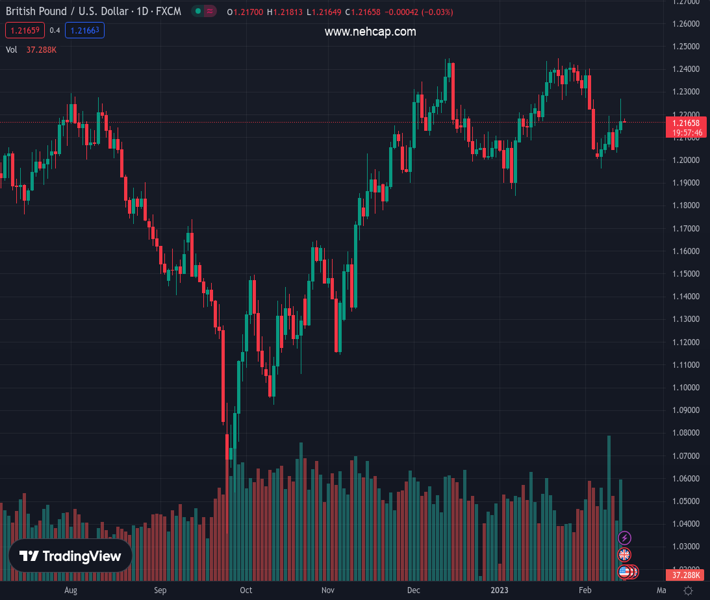
#GBPUSD @ 1.21664 remains sidelined after a volatile day, grinds higher of late. (Pivot Orderbook analysis)
…
This is a premium post.
[s2If !current_user_can(access_s2member_level4)]Please register for PREMIUM VERSION HERE to read full post below containing analysis. In case of any error or you think you are not able to read the full post below, please email us at support#nehcap.com [lwa][/s2If] [s2If current_user_can(access_s2member_level4)]
- GBP/USD remains sidelined after a volatile day, grinds higher of late.
- Mostly upbeat UK jobs report, hopes of British government-labor deal underpin bullish bias for the Cable.
- Unimpressive US inflation, retreat in Treasury bond yields add to the upside expectations.
- UK CPI for February eyed for intraday directions, US data appears important too.
The pair currently trades last at 1.21664.
The previous day high was 1.227 while the previous day low was 1.2118. The daily 38.2% Fib levels comes at 1.2212, expected to provide resistance. Similarly, the daily 61.8% fib level is at 1.2176, expected to provide resistance.
GBP/USD portrays the pre-data anxiety by treading water around 1.2180 during early Wednesday.
The Cable pair rose to the two-week high the previous day before reversing from 1.2270 as the US inflation propelled market moves. Even so, upbeat UK employment data joined hopes of overcoming the British workers’ strikes seemed to have put a floor under the GBP/USD prices.
Late Tuesday, the Financial Times (FT) quoted officials familiar with the matter to mention that UK Prime Minister Rishi Sunak and Finance Minister Jeremy Hunt are mulling giving NHS staff and other key workers a lump sum payment by backdating next year’s pay award, which takes effect from April, likely to the start of January 2023.
Before that, the UK Office for National Statistics (ONS) released mixed employment numbers with an unchanged ILO Unemployment Rate of 3.7% for three months to December contrasting with a decline in the Claimant Count Change, to -12.9K versus -3.2K prior. The details suggested an increase in Average Earnings Excluding Bonuses and a number of payrolled employees versus a fall in the UK vacancies. The mixed data, however, managed to help the British Pound (GBP) on release.
On the other hand, the US US Consumer Price Index (CPI) rose past market expectations to 6.4% YoY but posted the slowest increase since 2021 while easing below 6.5% prior. Following the data, Dallas Fed President Lorie Logan stated that they must remain prepared to continue rate increases for a longer period than previously anticipated. On the same line was New York Fed President John Williams who noted that the work to control too high inflation is not yet done. Additionally, Philadelphia Fed President Patrick Harker signaled that they are not done (with lifting rates), but they are likely close.
Against this backdrop, US 10-year Treasury bond yields seesaw around 3.75%, after rising three basis points (bps) to refresh a six-week high whereas the two-year counterpart jumped to the highest level since early November 2022 by poking 4.62%, around 4.61% at the latest. Further, S&P 500 Futures trace Wall Street’s downbeat closing to highlight the mildly offbeat mood.
Looking forward, the UK CPI for January, expected to ease to 10.3% YoY versus 10.5% prior, becomes crucial for the GBP/USD traders amid hopes that the Bank of England (BoE) has limited scope for further rate hikes. Following that, US Retail Sales and Industrial Production details for January, as well as NY Empire State Manufacturing Index for February, should be watched closely for clear directions.
Also read: UK Inflation Preview: Will softer CPI raise odds of a BoE pause?
A successful break of the 50-DMA, around 1.2190 by the press time, becomes necessary for the GBP/USD buyers to keep the reins.
Technical Levels: Supports and Resistances
GBPUSD currently trading at 1.2174 at the time of writing. Pair opened at 1.2177 and is trading with a change of -0.02% % .
| Overview | Overview.1 | |
|---|---|---|
| 0 | Today last price | 1.2174 |
| 1 | Today Daily Change | -0.0003 |
| 2 | Today Daily Change % | -0.02% |
| 3 | Today daily open | 1.2177 |
The pair is trading below its 20 Daily moving average @ 1.2249, below its 50 Daily moving average @ 1.2186 , above its 100 Daily moving average @ 1.1874 and above its 200 Daily moving average @ 1.1943
| Trends | Trends.1 | |
|---|---|---|
| 0 | Daily SMA20 | 1.2249 |
| 1 | Daily SMA50 | 1.2186 |
| 2 | Daily SMA100 | 1.1874 |
| 3 | Daily SMA200 | 1.1943 |
The previous day high was 1.227 while the previous day low was 1.2118. The daily 38.2% Fib levels comes at 1.2212, expected to provide resistance. Similarly, the daily 61.8% fib level is at 1.2176, expected to provide resistance.
Note the levels of interest below:
- Pivot support is noted at 1.2107, 1.2036, 1.1954
- Pivot resistance is noted at 1.2259, 1.234, 1.2411
| Levels | Levels.1 |
|---|---|
| Previous Daily High | 1.2270 |
| Previous Daily Low | 1.2118 |
| Previous Weekly High | 1.2194 |
| Previous Weekly Low | 1.1961 |
| Previous Monthly High | 1.2448 |
| Previous Monthly Low | 1.1841 |
| Daily Fibonacci 38.2% | 1.2212 |
| Daily Fibonacci 61.8% | 1.2176 |
| Daily Pivot Point S1 | 1.2107 |
| Daily Pivot Point S2 | 1.2036 |
| Daily Pivot Point S3 | 1.1954 |
| Daily Pivot Point R1 | 1.2259 |
| Daily Pivot Point R2 | 1.2340 |
| Daily Pivot Point R3 | 1.2411 |
[/s2If]
Join Our Telegram Group
")


