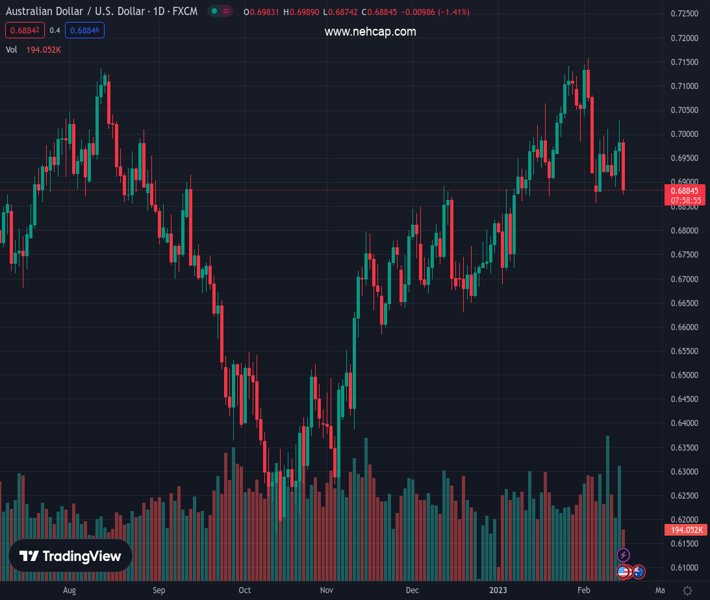
#AUDUSD @ 0.68822 drops back closer to the monthly low amid strong follow-through USD buying. (Pivot Orderbook analysis)
…
This is a premium post.
[s2If !current_user_can(access_s2member_level4)]Please register for PREMIUM VERSION HERE to read full post below containing analysis. In case of any error or you think you are not able to read the full post below, please email us at support#nehcap.com [lwa][/s2If] [s2If current_user_can(access_s2member_level4)]
- AUD/USD drops back closer to the monthly low amid strong follow-through USD buying.
- The upbeat US macro data reaffirms hawkish Fed expectations and boost the Greenback.
- The prevalent risk-off mood also benefits the buck and weighs on the risk-sensitive Aussie.
The pair currently trades last at 0.68822.
The previous day high was 0.703 while the previous day low was 0.6922. The daily 38.2% Fib levels comes at 0.6988, expected to provide resistance. Similarly, the daily 61.8% fib level is at 0.6963, expected to provide resistance.
The AUD/USD pair maintains its heavily offered tone through the early North American session and drops back closer to the monthly low in reaction to the upbeat US macro data. The pair is currently trading around the 0.6885-0.6880 area, with bears now awaiting a sustained break below the 50-day SMA before placing fresh bets.
The US Census Bureau reported that monthly Retail Sales grew by 3% in January, beating estimates for a 1.8% by a big margin. Furthermore, core retail sales, excluding autos, jumped 2.3% during the reported month, up sharply from the 0.9% decline (revised higher) recorded in December. Separately, the New York Fed’s Empire State Manufacturing Index also surpassed expectations and improved to -5.8 in February from -32.9 previous.
The data cemented bets for further policy tightening by the Fed and provides a fresh lift to the US Dollar, which, in turn, exerts downward pressure on the AUD/USD pair. Meanwhile, worries about economic headwinds stemming from rapidly rising borrowing costs take its toll on the global risk sentiment. This is evident from a sea of red across the equity markets and is seen as another factor weighing on the risk-sensitive Aussie.
From a technical perspective, the AUD/USD pair now seems to have confirmed a bearish breakdown through an upward-sloping trend-line extending from October 2022 swing low. Some follow-through selling below the 50-day SMA will reaffirm the negative bias. This should pave the way for an extension of the recent pullback from the highest level since June 2022, around the 0.7155-0.7160 area touched earlier this month.
Technical Levels: Supports and Resistances
AUDUSD currently trading at 0.6891 at the time of writing. Pair opened at 0.6992 and is trading with a change of -1.44 % .
| Overview | Overview.1 | |
|---|---|---|
| 0 | Today last price | 0.6891 |
| 1 | Today Daily Change | -0.0101 |
| 2 | Today Daily Change % | -1.4400 |
| 3 | Today daily open | 0.6992 |
The pair is trading below its 20 Daily moving average @ 0.7002, above its 50 Daily moving average @ 0.688 , above its 100 Daily moving average @ 0.6695 and above its 200 Daily moving average @ 0.6806
| Trends | Trends.1 | |
|---|---|---|
| 0 | Daily SMA20 | 0.7002 |
| 1 | Daily SMA50 | 0.6880 |
| 2 | Daily SMA100 | 0.6695 |
| 3 | Daily SMA200 | 0.6806 |
The previous day high was 0.703 while the previous day low was 0.6922. The daily 38.2% Fib levels comes at 0.6988, expected to provide resistance. Similarly, the daily 61.8% fib level is at 0.6963, expected to provide resistance.
Note the levels of interest below:
- Pivot support is noted at 0.6932, 0.6873, 0.6824
- Pivot resistance is noted at 0.7041, 0.7089, 0.7149
| Levels | Levels.1 |
|---|---|
| Previous Daily High | 0.7030 |
| Previous Daily Low | 0.6922 |
| Previous Weekly High | 0.7011 |
| Previous Weekly Low | 0.6856 |
| Previous Monthly High | 0.7143 |
| Previous Monthly Low | 0.6688 |
| Daily Fibonacci 38.2% | 0.6988 |
| Daily Fibonacci 61.8% | 0.6963 |
| Daily Pivot Point S1 | 0.6932 |
| Daily Pivot Point S2 | 0.6873 |
| Daily Pivot Point S3 | 0.6824 |
| Daily Pivot Point R1 | 0.7041 |
| Daily Pivot Point R2 | 0.7089 |
| Daily Pivot Point R3 | 0.7149 |
[/s2If]
Join Our Telegram Group
")


