#XAUUSD @ 1,854.59 Gold price remains depressed around six-week low after a volatile day., @nehcap view: Further downside expected (Pivot Orderbook analysis)
…
This is a premium post.
[s2If !current_user_can(access_s2member_level4)]Please register for PREMIUM VERSION HERE to read full post below containing analysis. In case of any error or you think you are not able to read the full post below, please email us at support#nehcap.com [lwa][/s2If] [s2If current_user_can(access_s2member_level4)]
- Gold price remains depressed around six-week low after a volatile day.
- Federal Reserve officials remained hawkish on interest rates despite softer United States inflation.
- Fed talks weighed on XAU/USD via upbeat US Treasury bond yields, US Dollar.
- Risk catalyst, US Retail Sales eyed for fresh impulse.
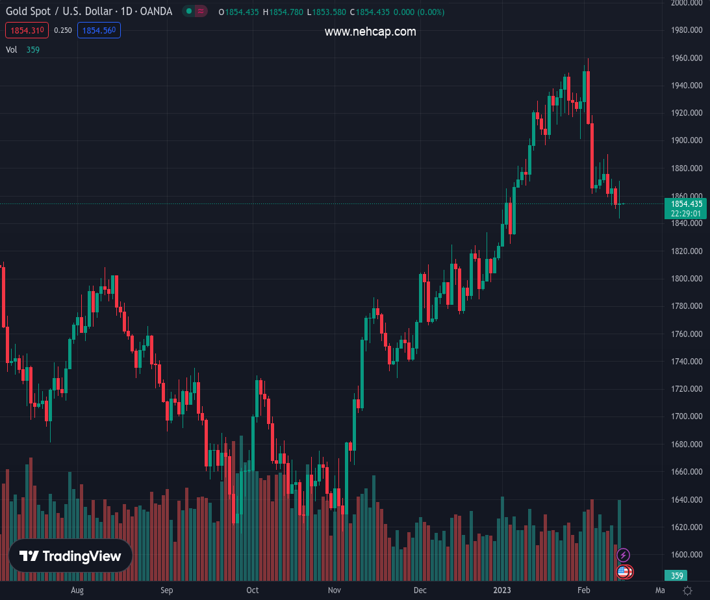
The pair currently trades last at 1854.59.
The previous day high was 1866.65 while the previous day low was 1850.48. The daily 38.2% Fib levels comes at 1856.66, expected to provide resistance. Similarly, the daily 61.8% fib level is at 1860.47, expected to provide resistance.
Gold price (XAU/USD) prints mild losses around the mid-$1,800s, fading the bounce off a 1.5-month low, as traders await more clues to extend the United States inflation-inflicted downside during early Wednesday. Even so, the hawkish Federal Reserve comments and technical breakdown keep the XAU/USD bears hopeful of keeping the reins ahead of the US Retail Sales.
The United States Consumer Price Index (CPI) rose past market expectations to 6.4% YoY but posted the slowest increase since 2021 while easing below 6.5% prior. More importantly, CPI ex Food & Energy, better known as the Core CPI, grew 5.6% YoY compared to 5.5% market forecasts and the 5.7% previous readings. Following the data, the US Dollar renewed its intraday low before the Federal Reserve (Fed) talks propelled the US Treasury bond yields and the US Dollar, which in turn weighed on the Gold price.
Most of the Federal Reserve (Fed) policymakers were in favor of further rate hikes even as the United States inflation failed to match “positive surprise” hopes. The same propelled the US Treasury bond yields and US Dollar. That said, Dallas Fed President Lorie Logan stated that they must remain prepared to continue rate increases for a longer period than previously anticipated. On the same line was New York Fed President John Williams who noted that the work to control too high inflation is not yet done. Additionally, Philadelphia Fed President Patrick Harker signaled that they are not done (with lifting rates), but they are likely close.
Given the Federal Reserve (Fed) officials’ hawkish comments, despite unimpressive United States inflation, the US Treasury bond yields refreshed their monthly high and allowed the US Dollar buyers to return following an initial dip to refresh the weekly low. T
US 10-year Treasury bond yields seesaw around 3.75%, up three basis points (bps) after refreshing a six-week high whereas the two-year counterpart jumped to the highest level since early November 2022 by poking 4.62%. That said, the US Dollar Index (DXY) bounced off one week low to end the day on the positive side near 103.25. Further, Wall Street closed mixed even after the mostly upbeat performance of the Asian and European markets.
Although the Fed hawks joined the technical breakdown to tease the Gold bears, the metal’s further downside hinges on how well the scheduled United States data can entertain the XAU/USD sellers. Among them, US Retail Sales for January, expected 1.8% versus -1.1% prior, will be closely watched for clear directions. Should the data manage to reverse the previous monthly contraction, the odds of witnessing further XAU/USD downside can’t be ruled out.
Other than the data, fears surrounding the US-China geopolitical ties and the Federal Reserve (Fed) talks will also be important for Gold traders to watch for clear directions.
Gold price portrays the first daily closing below the 50-DMA since early November 2022 and joins the bearish signals from the Moving Average Convergence and Divergence (MACD) to keep the sellers hopeful. Also favoring the downside bias is the Relative Strength Index (RSI) line, placed at 14, as well as a sustained break of the previous support line stretched from late November.
That said, the XAU/USD appears vulnerable to testing the 38.2% Fibonacci retracement level of the Gold price upside from September 2022 to February 2023, near $1,827. However, a six-month-old horizontal support region, around $1,805, could challenge the metal sellers afterward.
On the contrary, the 50-DMA and the multi-day-old previous support line, respectively near $1,860 and $1,878, can cap short-term XAU/USD rebound before highlighting the previous weekly top surrounding $1,890 as the hurdle for the Gold buyers.
It’s worth noting that the Gold price upside remains elusive unless the quote remains successfully above the $1,900 threshold.
Trend: Further downside expected
Technical Levels: Supports and Resistances
XAUUSD currently trading at 1854.1 at the time of writing. Pair opened at 1854.29 and is trading with a change of -0.01% % .
| Overview | Overview.1 | |
|---|---|---|
| 0 | Today last price | 1854.1 |
| 1 | Today Daily Change | -0.19 |
| 2 | Today Daily Change % | -0.01% |
| 3 | Today daily open | 1854.29 |
The pair is trading below its 20 Daily moving average @ 1906.06, below its 50 Daily moving average @ 1857.38 , above its 100 Daily moving average @ 1778.87 and above its 200 Daily moving average @ 1775.81
| Trends | Trends.1 | |
|---|---|---|
| 0 | Daily SMA20 | 1906.06 |
| 1 | Daily SMA50 | 1857.38 |
| 2 | Daily SMA100 | 1778.87 |
| 3 | Daily SMA200 | 1775.81 |
The previous day high was 1866.65 while the previous day low was 1850.48. The daily 38.2% Fib levels comes at 1856.66, expected to provide resistance. Similarly, the daily 61.8% fib level is at 1860.47, expected to provide resistance.
Note the levels of interest below:
- Pivot support is noted at 1847.63, 1840.97, 1831.46
- Pivot resistance is noted at 1863.8, 1873.31, 1879.97
| Levels | Levels.1 |
|---|---|
| Previous Daily High | 1866.65 |
| Previous Daily Low | 1850.48 |
| Previous Weekly High | 1890.27 |
| Previous Weekly Low | 1852.84 |
| Previous Monthly High | 1949.27 |
| Previous Monthly Low | 1823.76 |
| Daily Fibonacci 38.2% | 1856.66 |
| Daily Fibonacci 61.8% | 1860.47 |
| Daily Pivot Point S1 | 1847.63 |
| Daily Pivot Point S2 | 1840.97 |
| Daily Pivot Point S3 | 1831.46 |
| Daily Pivot Point R1 | 1863.80 |
| Daily Pivot Point R2 | 1873.31 |
| Daily Pivot Point R3 | 1879.97 |
[/s2If]
Join Our Telegram Group
")


