#XAGUSD @ 21.985 Silver extends its sideways consolidative price move around the $22.00 mark on Tuesday. (Pivot Orderbook analysis)
…
This is a premium post.
[s2If !current_user_can(access_s2member_level4)]Please register for PREMIUM VERSION HERE to read full post below containing analysis. In case of any error or you think you are not able to read the full post below, please email us at support#nehcap.com [lwa][/s2If] [s2If current_user_can(access_s2member_level4)]
- Silver extends its sideways consolidative price move around the $22.00 mark on Tuesday.
- The technical setup favours bearish traders and supports prospects for additional losses.
- A sustained break below the 100-day SMA support is needed to confirm the negative bias.
The pair currently trades last at 21.985.
The previous day high was 22.08 while the previous day low was 21.79. The daily 38.2% Fib levels comes at 21.9, expected to provide support. Similarly, the daily 61.8% fib level is at 21.97, expected to provide support.
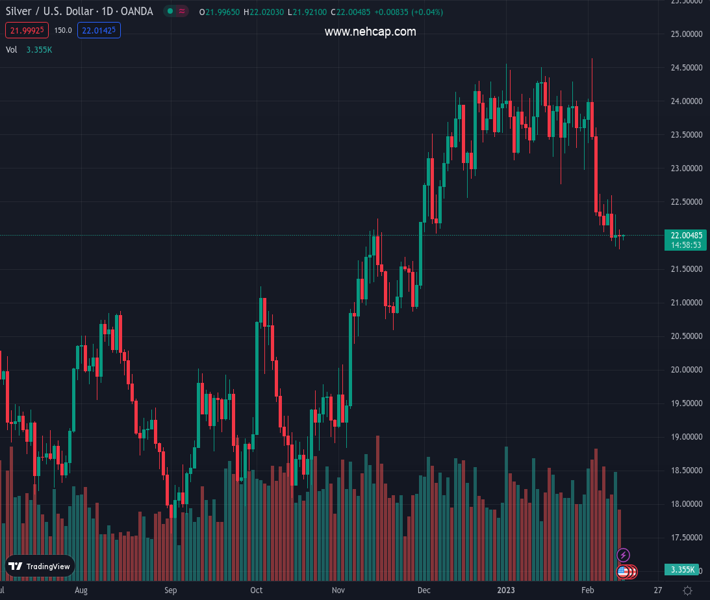
Silver continues with its struggle to gain any meaningful traction on Tuesday and remains confined in a narrow range through the early European session. The white metal is currently placed around the $22.00 mark and seems vulnerable to prolonging its recent pullback from the $24.65 area, or the highest level since April 2022 touched earlier this month.
Last week’s sustained break and acceptance below the 38.2% Fibonacci retracement level of the recent rally from October 2022 adds credence to the negative outlook. Furthermore, technical indicators on the daily chart are holding deep in the negative territory and are still far from being in the oversold zone. This, in turn, supports prospects for a further near-term depreciating move.
That said, bearish traders might wait for some follow-through selling below the 100-day SMA, currently around the $21.75 region, before placing fresh bets. The XAG/USD would then turn vulnerable to testing the 50% Fibo. level, around the $21.35 area. The downward trajectory could get extended further towards the $21.00 level en route to the 61.8% Fibo. level, around the $20.60-$20.55 zone.
On the flip side, a recovery above 38.2% Fibo. level, around the $22.15 area, is more likely to attract fresh sellers near the $22.60-$22.70 supply zone. This should cap the XAG/USD near the $23.00 mark, representing the 23.6% Fibo. That said, a convincing breakthrough the latter could offset the negative outlook and shift the near-term bias in favour of bullish traders.
The subsequent move up has the potential to lift the XAG/USD further towards reclaiming the $24.00 round-figure mark. Bulls might then aim back to challenge the $24.50 supply zone, which if cleared decisively should pave the way for a fresh leg up.
Technical Levels: Supports and Resistances
XAGUSD currently trading at 21.95 at the time of writing. Pair opened at 21.97 and is trading with a change of -0.09 % .
| Overview | Overview.1 | |
|---|---|---|
| 0 | Today last price | 21.95 |
| 1 | Today Daily Change | -0.02 |
| 2 | Today Daily Change % | -0.09 |
| 3 | Today daily open | 21.97 |
The pair is trading below its 20 Daily moving average @ 23.17, below its 50 Daily moving average @ 23.43 , above its 100 Daily moving average @ 21.86 and above its 200 Daily moving average @ 21.0
| Trends | Trends.1 | |
|---|---|---|
| 0 | Daily SMA20 | 23.17 |
| 1 | Daily SMA50 | 23.43 |
| 2 | Daily SMA100 | 21.86 |
| 3 | Daily SMA200 | 21.00 |
The previous day high was 22.08 while the previous day low was 21.79. The daily 38.2% Fib levels comes at 21.9, expected to provide support. Similarly, the daily 61.8% fib level is at 21.97, expected to provide support.
Note the levels of interest below:
- Pivot support is noted at 21.82, 21.66, 21.53
- Pivot resistance is noted at 22.11, 22.24, 22.4
| Levels | Levels.1 |
|---|---|
| Previous Daily High | 22.08 |
| Previous Daily Low | 21.79 |
| Previous Weekly High | 22.62 |
| Previous Weekly Low | 21.84 |
| Previous Monthly High | 24.55 |
| Previous Monthly Low | 22.76 |
| Daily Fibonacci 38.2% | 21.90 |
| Daily Fibonacci 61.8% | 21.97 |
| Daily Pivot Point S1 | 21.82 |
| Daily Pivot Point S2 | 21.66 |
| Daily Pivot Point S3 | 21.53 |
| Daily Pivot Point R1 | 22.11 |
| Daily Pivot Point R2 | 22.24 |
| Daily Pivot Point R3 | 22.40 |
[/s2If]
Join Our Telegram Group
")


