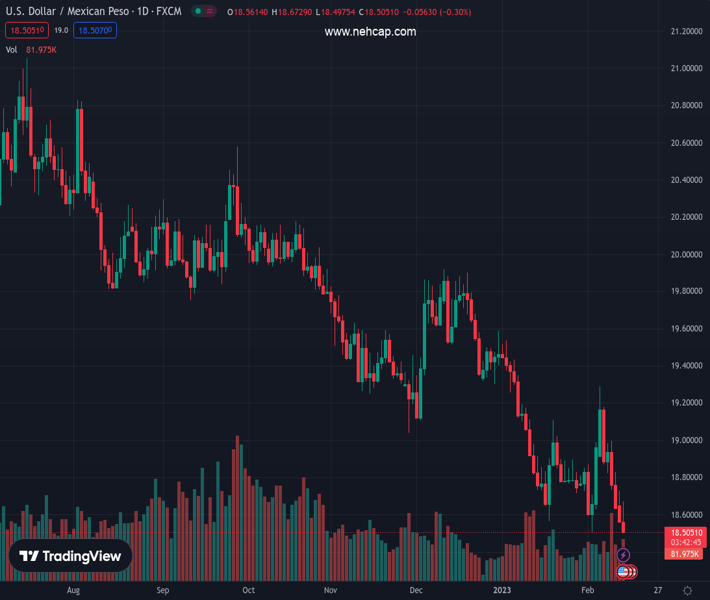
#USDMXN @ 18.5069 dropped to a new YTD low at 18.4975 during the session. (Pivot Orderbook analysis)
…
This is a premium post.
[s2If !current_user_can(access_s2member_level4)]Please register for PREMIUM VERSION HERE to read full post below containing analysis. In case of any error or you think you are not able to read the full post below, please email us at support#nehcap.com [lwa][/s2If] [s2If current_user_can(access_s2member_level4)]
- USD/MXN dropped to a new YTD low at 18.4975 during the session.
- The US Dollar is extending its losses after a mixed US inflation report.
- USD/MXN Price Analysis: To resume its downward bias if it achieves a daily close below $18.50.
The pair currently trades last at 18.5069.
The previous day high was 18.7285 while the previous day low was 18.5779. The daily 38.2% Fib levels comes at 18.6355, expected to provide resistance. Similarly, the daily 61.8% fib level is at 18.671, expected to provide resistance.
The Mexican Peso (MXN) extended its gains against the US Dollar (USD) on Tuesday following the release of US inflation data, which showed that prices in the United States are slowing down. Therefore, speculators pricing in a less hawkish Fed sold the greenback vs. the peso. At the time of writing, the USD/MXN exchanges hand at 18.5115, below its opening price by 0.27%.
Technically speaking, the USD/MXN would continue to aim lower, as portrayed by the daily chart. After spiking to its daily high of 18.6729, the USD/MXN resumed its downtrend, which witnessed the pair dropping to fresh four and a half year low at 18.4975, a level last seen in August 2019. However, a bounce in that area trimmed some of the pair’s losses, sitting at around 18.50.
If the USD/MXN achieves a daily close below 18.50, that will exacerbate a fall towards August 7, 2018, at 18.4047, followed by a test of the $18.00 figure. In an alternate scenario, the USD/MXN’s first resistance would be the February 13 daily high of 18.7284. Break above would expose the 20-day Exponential Moving Average (EMA) at 18.8133, followed by the psychological barrier at 19.0000.
Oscillators, like the Relative Strength Index (RSI), suggest a bearish continuation, though a positive divergence is in the making, indicating that a reversal could be around the corner. The Rate of Change (RoC) portrays that although sellers are in control, momentum is fading.
Technical Levels: Supports and Resistances
USDMXN currently trading at 18.5285 at the time of writing. Pair opened at 18.5842 and is trading with a change of -0.3 % .
| Overview | Overview.1 | |
|---|---|---|
| 0 | Today last price | 18.5285 |
| 1 | Today Daily Change | -0.0557 |
| 2 | Today Daily Change % | -0.3000 |
| 3 | Today daily open | 18.5842 |
The pair remains strongly bearish on the daily time frame. It trades below the 20 SMA @ 18.8123, 50 SMA 19.1863, 100 SMA @ 19.4579 and 200 SMA @ 19.7961.
| Trends | Trends.1 | |
|---|---|---|
| 0 | Daily SMA20 | 18.8123 |
| 1 | Daily SMA50 | 19.1863 |
| 2 | Daily SMA100 | 19.4579 |
| 3 | Daily SMA200 | 19.7961 |
The previous day high was 18.7285 while the previous day low was 18.5779. The daily 38.2% Fib levels comes at 18.6355, expected to provide resistance. Similarly, the daily 61.8% fib level is at 18.671, expected to provide resistance.
Note the levels of interest below:
- Pivot support is noted at 18.5319, 18.4796, 18.3813
- Pivot resistance is noted at 18.6825, 18.7808, 18.8331
| Levels | Levels.1 |
|---|---|
| Previous Daily High | 18.7285 |
| Previous Daily Low | 18.5779 |
| Previous Weekly High | 19.2901 |
| Previous Weekly Low | 18.6390 |
| Previous Monthly High | 19.5361 |
| Previous Monthly Low | 18.5663 |
| Daily Fibonacci 38.2% | 18.6355 |
| Daily Fibonacci 61.8% | 18.6710 |
| Daily Pivot Point S1 | 18.5319 |
| Daily Pivot Point S2 | 18.4796 |
| Daily Pivot Point S3 | 18.3813 |
| Daily Pivot Point R1 | 18.6825 |
| Daily Pivot Point R2 | 18.7808 |
| Daily Pivot Point R3 | 18.8331 |
[/s2If]
Join Our Telegram Group
")


