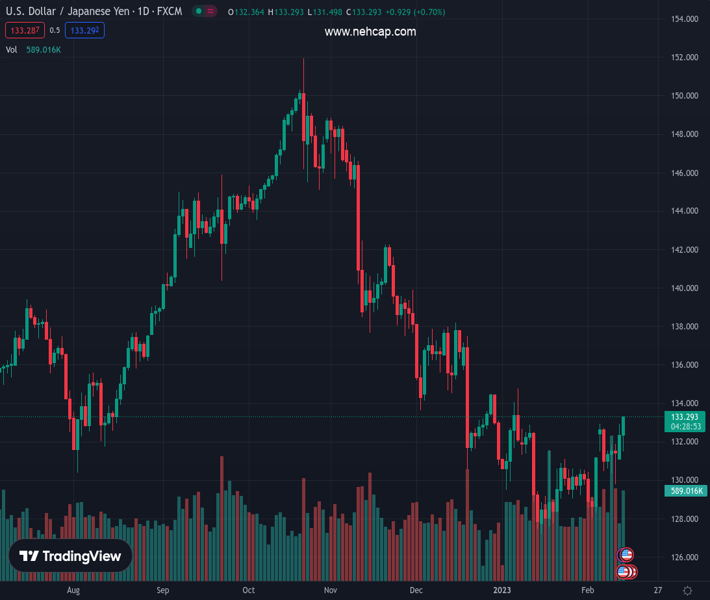
#USDJPY @ 133.230 registers gains of 0.50%, above the 133.00 mark. (Pivot Orderbook analysis)
…
This is a premium post.
[s2If !current_user_can(access_s2member_level4)]Please register for PREMIUM VERSION HERE to read full post below containing analysis. In case of any error or you think you are not able to read the full post below, please email us at support#nehcap.com [lwa][/s2If] [s2If current_user_can(access_s2member_level4)]
- USD/JPY registers gains of 0.50%, above the 133.00 mark.
- US inflation data, albeit mixed, spurred a jump in US Treasury bond yields, a tailwind for the USD/JPY.
- USD/JPY Price Analysis: Daily close above 133.00 would pave the way for further gains.
The pair currently trades last at 133.230.
The previous day high was 132.91 while the previous day low was 131.27. The daily 38.2% Fib levels comes at 132.29, expected to provide support. Similarly, the daily 61.8% fib level is at 131.9, expected to provide support.
The USD/JPY reached a new YTD high of 133.13, though it failed to cling to those gains, retracing beneath last week’s high of 132.90 after the release of US economic data, spurring a retracement. Therefore, the USD/JPY consolidates within the 132.70-133.00 area. At the time of writing, exchanges hands at 133.06.
Fundamentally speaking, the Department of Labor (DoL) revealed that inflation in the United States (US) cooled down annually but came slightly above estimates. The Consumer Price Index (CPI) for January rose by 6.4% YoY, above forecasts of 6.2%, while core CPI jumped to 5.6% YoY, against data estimated at 5.5%. Monthly basis readings were in line with estimates.
On the Japanese front, the confirmation of the Bank of Japan’s (BoJ) new Governor, Kazuo Ueda, sparked speculations that the BoJ would abandon the Yield Curve Control (YCC) imposed under Governor Haruhiko Kuroda’s term. Thar should be considered bullish for the Japanese Yen (JPY), which has extended its losses in the North American session so far.
Elsewhere, Federal Reserve (Fed) officials continued to express the need to hike rates for longer than expected, according to Dallas Fed President Lorie Logan. She echoed some earlier comments of Richmond’s Fed President Thomas Barkin, who said that inflation risks still outweigh others.
After hitting a daily low of 131.49, the USD/JPY encountered some buyers around the latter, rallying sharply towards 133.00, underpinned by the US 10-year Treasury bond yield. To further extend its gains, the USD/JPY needs to clear the 200-day Exponential Moving Average (EMA) at 133.76, which would pave the way to 134.00. In an alternate scenario, the USD/JPY struggling to hold above 133.00 would open the door toward the 50-day EMA At 132.67, ahead of the 132.00 figure.
Technical Levels: Supports and Resistances
USDJPY currently trading at 133.06 at the time of writing. Pair opened at 132.29 and is trading with a change of 0.58 % .
| Overview | Overview.1 | |
|---|---|---|
| 0 | Today last price | 133.06 |
| 1 | Today Daily Change | 0.77 |
| 2 | Today Daily Change % | 0.58 |
| 3 | Today daily open | 132.29 |
The pair is trading above its 20 Daily moving average @ 130.27, above its 50 Daily moving average @ 132.18 , below its 100 Daily moving average @ 138.08 and below its 200 Daily moving average @ 136.84
| Trends | Trends.1 | |
|---|---|---|
| 0 | Daily SMA20 | 130.27 |
| 1 | Daily SMA50 | 132.18 |
| 2 | Daily SMA100 | 138.08 |
| 3 | Daily SMA200 | 136.84 |
The previous day high was 132.91 while the previous day low was 131.27. The daily 38.2% Fib levels comes at 132.29, expected to provide support. Similarly, the daily 61.8% fib level is at 131.9, expected to provide support.
Note the levels of interest below:
- Pivot support is noted at 131.41, 130.52, 129.77
- Pivot resistance is noted at 133.04, 133.8, 134.68
| Levels | Levels.1 |
|---|---|
| Previous Daily High | 132.91 |
| Previous Daily Low | 131.27 |
| Previous Weekly High | 132.91 |
| Previous Weekly Low | 129.81 |
| Previous Monthly High | 134.78 |
| Previous Monthly Low | 127.22 |
| Daily Fibonacci 38.2% | 132.29 |
| Daily Fibonacci 61.8% | 131.90 |
| Daily Pivot Point S1 | 131.41 |
| Daily Pivot Point S2 | 130.52 |
| Daily Pivot Point S3 | 129.77 |
| Daily Pivot Point R1 | 133.04 |
| Daily Pivot Point R2 | 133.80 |
| Daily Pivot Point R3 | 134.68 |
[/s2If]
Join Our Telegram Group
")


