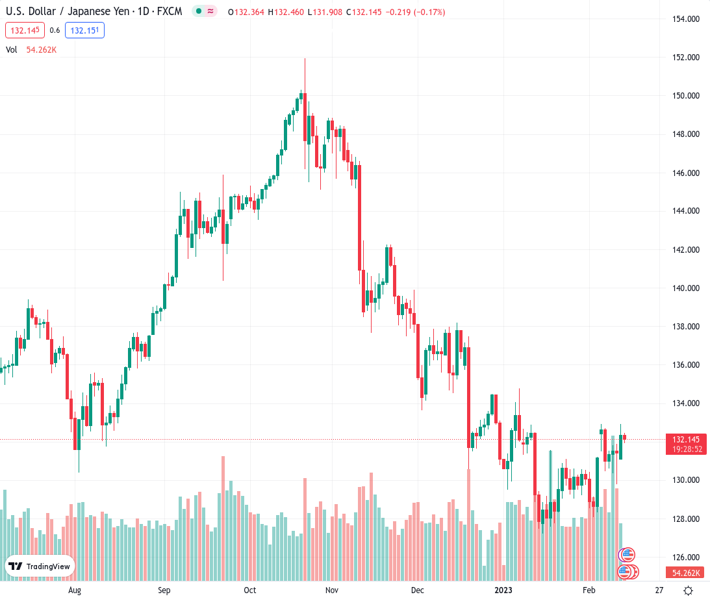
#USDJPY @ 132.156 bounces off intraday low, keeps extends pullback from five-week high., @nehcap view: Further downside expected (Pivot Orderbook analysis)
…
This is a premium post.
[s2If !current_user_can(access_s2member_level4)]Please register for PREMIUM VERSION HERE to read full post below containing analysis. In case of any error or you think you are not able to read the full post below, please email us at support#nehcap.com [lwa][/s2If] [s2If current_user_can(access_s2member_level4)]
- USD/JPY bounces off intraday low, keeps extends pullback from five-week high.
- RSI’s retreat from overbought conditions joins double top bearish formation to favor sellers.
- 200-HMA, triangle’s support line probe bears even as MACD signals hint at further downside.
The pair currently trades last at 132.156.
The previous day high was 132.91 while the previous day low was 131.27. The daily 38.2% Fib levels comes at 132.29, expected to provide resistance. Similarly, the daily 61.8% fib level is at 131.9, expected to provide support.
USD/JPY prints mild losses around the intraday low of 131.90 as the Japanese government officially nominates Kazuo Ueda to become the next Bank of Japan (BoJ) Governor on early Tuesday.
In doing so, the Yen pair extends the early-day pullback from the previous weekly to surrounding 132.90 and forms “Double tops”, a bearish chart pattern. Also justifying the USD/JPY pair’s latest weakness is the RSI (14) line that took a U-turn from the overbought conditions, not to forget the bearish MACD signals.
With this, the quote is likely to decline toward the 200-Hour Moving Average (HMA) level surrounding 131.00. However, an upward-sloping support line from February 02, forming part of the short-term triangle, could challenge the pair sellers around 130.30 afterward.
In a case where the USD/JPY drops below 130.30, the 130.00 round figure may act as a validation point for the quote’s further downside.
Alternatively, recovery moves remain elusive unless trading below the double tops surrounding 132.90. Also acting as the upside filter is the 133.00 round figure.
Following that, a run-up towards the previous monthly peak surrounding 134.80 can’t be ruled out.
Trend: Further downside expected
Technical Levels: Supports and Resistances
USDJPY currently trading at 132.07 at the time of writing. Pair opened at 132.29 and is trading with a change of -0.17% % .
| Overview | Overview.1 | |
|---|---|---|
| 0 | Today last price | 132.07 |
| 1 | Today Daily Change | -0.22 |
| 2 | Today Daily Change % | -0.17% |
| 3 | Today daily open | 132.29 |
The pair is trading above its 20 Daily moving average @ 130.27, below its 50 Daily moving average @ 132.18 , below its 100 Daily moving average @ 138.08 and below its 200 Daily moving average @ 136.84
| Trends | Trends.1 | |
|---|---|---|
| 0 | Daily SMA20 | 130.27 |
| 1 | Daily SMA50 | 132.18 |
| 2 | Daily SMA100 | 138.08 |
| 3 | Daily SMA200 | 136.84 |
The previous day high was 132.91 while the previous day low was 131.27. The daily 38.2% Fib levels comes at 132.29, expected to provide resistance. Similarly, the daily 61.8% fib level is at 131.9, expected to provide support.
Note the levels of interest below:
- Pivot support is noted at 131.41, 130.52, 129.77
- Pivot resistance is noted at 133.04, 133.8, 134.68
| Levels | Levels.1 |
|---|---|
| Previous Daily High | 132.91 |
| Previous Daily Low | 131.27 |
| Previous Weekly High | 132.91 |
| Previous Weekly Low | 129.81 |
| Previous Monthly High | 134.78 |
| Previous Monthly Low | 127.22 |
| Daily Fibonacci 38.2% | 132.29 |
| Daily Fibonacci 61.8% | 131.90 |
| Daily Pivot Point S1 | 131.41 |
| Daily Pivot Point S2 | 130.52 |
| Daily Pivot Point S3 | 129.77 |
| Daily Pivot Point R1 | 133.04 |
| Daily Pivot Point R2 | 133.80 |
| Daily Pivot Point R3 | 134.68 |
[/s2If]
Join Our Telegram Group
")


