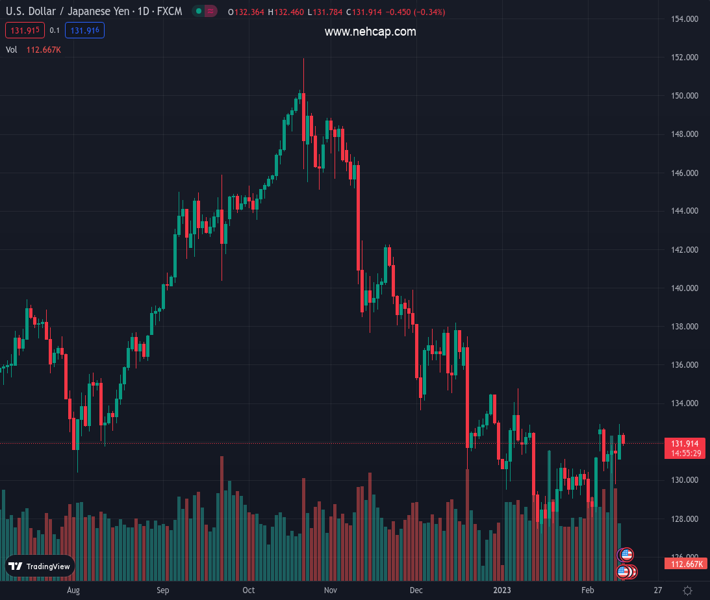
#USDJPY @ 131.878 prints mild losses while reversing from monthly high. (Pivot Orderbook analysis)
…
This is a premium post.
[s2If !current_user_can(access_s2member_level4)]Please register for PREMIUM VERSION HERE to read full post below containing analysis. In case of any error or you think you are not able to read the full post below, please email us at support#nehcap.com [lwa][/s2If] [s2If current_user_can(access_s2member_level4)]
- USD/JPY prints mild losses while reversing from monthly high.
- Treasury bond yields remain pressured amid market’s indecision ahead of the key US CPI.
- Mixed Japan GDP gained little attention as Ueda’s nomination as BoJ leader appears hawkish.
The pair currently trades last at 131.878.
The previous day high was 132.91 while the previous day low was 131.27. The daily 38.2% Fib levels comes at 132.29, expected to provide resistance. Similarly, the daily 61.8% fib level is at 131.9, expected to provide resistance.
USD/JPY bounces off intraday low but remains stuck with mild losses near 132.00 amid early Tuesday morning in Europe.
The Yen pair initially cheered the pullback in the Treasury bond yields before the Japanese government’s announcements of Bank of Japan (BoJ) officials triggered hawkish concerns and weighed on the prices. Also favoring the USD/JPY bears is the broad US Dollar pullback as traders brace for a positive surprise from the US Consumer Price Index (CPI) for January.
Earlier in the day, Japan’s preliminary readings of the fourth quarter (Q4) Gross Domestic Product (GDP) data printed mixed readings. Following that, the official nomination of Kazuo Ueda as the BoJ leader weighed on the USD/JPY prices. That said, Bloomberg came out with an analysis suggesting further challenges to the Bank of Japan’s (BoJ) easy money policy during the incoming Kazuo Ueda’s reign. It’s worth noting that Ueda previously defended the current monetary policy in his latest public speech.
On other hand, the US Federal Reserve (Fed) hawks kept defending the rate hike concerns but the market’s pricing of slower rate lifts and a nearer peak seemed to have weighed on the US Treasury bond yields. As a result, the US 10-year Treasury bond yields drop nearly two basis points to 3.69% at the latest, after reversing from a one-month high the previous day.
Elsewhere, fresh fears of the US-China tension over the balloon shooting also challenge the sentiment and put a floor under the USD/JPY price. US Congress will take a bipartisan look at unidentified aerial objects that have made their way into U.S. and Canadian airspace, and why they were not found sooner,” said US Senate Majority Leader Chuck Schumer. It’s worth noting that a US Military General previously ruled out odds favoring the likely hand of China in the “unidentified objects” which were shot down during the weekend.
Against this backdrop, S&P 500 Futures print mild losses whereas Japan’s Nikkei 225 rises 0.65% intraday to near 27,600 by the press time.
Moving on, the market consensus anticipates 6.2% YoY print of the US CPI for January but the odds of the positive surprise during the year-start are high, which in turn keeps USD/JPY bears on the dicey floor.
USD/JPY extends the early-day pullback from the previous weekly top surrounding 132.90 and forms “Double tops”, a bearish chart pattern. Also justifying the Yen pair’s latest weakness is the RSI (14) line that took a U-turn from the overbought conditions, not to forget the bearish MACD signals.
Technical Levels: Supports and Resistances
USDJPY currently trading at 131.98 at the time of writing. Pair opened at 132.29 and is trading with a change of -0.23% % .
| Overview | Overview.1 | |
|---|---|---|
| 0 | Today last price | 131.98 |
| 1 | Today Daily Change | -0.31 |
| 2 | Today Daily Change % | -0.23% |
| 3 | Today daily open | 132.29 |
The pair is trading above its 20 Daily moving average @ 130.27, below its 50 Daily moving average @ 132.18 , below its 100 Daily moving average @ 138.08 and below its 200 Daily moving average @ 136.84
| Trends | Trends.1 | |
|---|---|---|
| 0 | Daily SMA20 | 130.27 |
| 1 | Daily SMA50 | 132.18 |
| 2 | Daily SMA100 | 138.08 |
| 3 | Daily SMA200 | 136.84 |
The previous day high was 132.91 while the previous day low was 131.27. The daily 38.2% Fib levels comes at 132.29, expected to provide resistance. Similarly, the daily 61.8% fib level is at 131.9, expected to provide resistance.
Note the levels of interest below:
- Pivot support is noted at 131.41, 130.52, 129.77
- Pivot resistance is noted at 133.04, 133.8, 134.68
| Levels | Levels.1 |
|---|---|
| Previous Daily High | 132.91 |
| Previous Daily Low | 131.27 |
| Previous Weekly High | 132.91 |
| Previous Weekly Low | 129.81 |
| Previous Monthly High | 134.78 |
| Previous Monthly Low | 127.22 |
| Daily Fibonacci 38.2% | 132.29 |
| Daily Fibonacci 61.8% | 131.90 |
| Daily Pivot Point S1 | 131.41 |
| Daily Pivot Point S2 | 130.52 |
| Daily Pivot Point S3 | 129.77 |
| Daily Pivot Point R1 | 133.04 |
| Daily Pivot Point R2 | 133.80 |
| Daily Pivot Point R3 | 134.68 |
[/s2If]
Join Our Telegram Group
")


