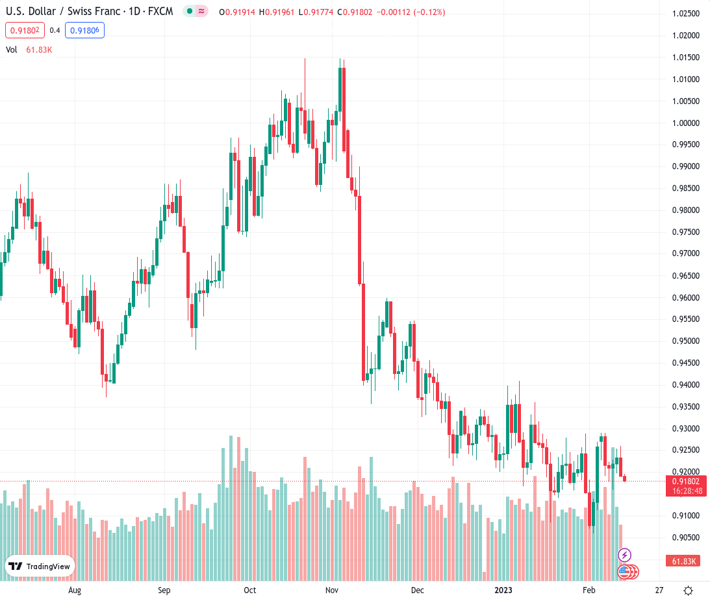
#USDCHF @ 0.91794 takes offers to renew intraday low, stretching pullback from weekly top., @nehcap view: Further downside expected (Pivot Orderbook analysis)
…
This is a premium post.
[s2If !current_user_can(access_s2member_level4)]Please register for PREMIUM VERSION HERE to read full post below containing analysis. In case of any error or you think you are not able to read the full post below, please email us at support#nehcap.com [lwa][/s2If] [s2If current_user_can(access_s2member_level4)]
- USD/CHF takes offers to renew intraday low, stretching pullback from weekly top.
- Clear downside break of short-term key trend line, SMA joins downbeat oscillators to favor bearish bias.
- Recovery remains elusive unless crossing five-week-old resistance line.
The pair currently trades last at 0.91794.
The previous day high was 0.926 while the previous day low was 0.9191. The daily 38.2% Fib levels comes at 0.9218, expected to provide resistance. Similarly, the daily 61.8% fib level is at 0.9234, expected to provide resistance.
USD/CHF prints mild losses around 0.9180 heading into Tuesday’s European session, stretching the previous day’s downside break of the key support ahead of the all-important US inflation data.
Not only the downside break of the 100-SMA and a two-week-old ascending trend line but bearish MACD signals and downbeat RSI (14), not oversold, also favor the USD/CHF bears.
That said, a horizontal area comprising multiple levels marked since January 09, close to 0.9165-60, appears imminent support for the Swiss currency pair to test.
Following that, the 0.9100 round figure and the previous monthly low near 0.9085 could act as intermediate halts before directing the USD/CHF bears toward the monthly bottom surrounding 0.9060.
Meanwhile, recovery moves appear elusive unless crossing the convergence of the 100-SMA and the aforementioned support line, close to 0.9210.
Even if the USD/CHF manages to stay firmer past 0.9210, a downward-sloping resistance line from January 06, near 0.9260, could act as the last defense of the pair bears.
Overall, USD/CHF remains bearish as traders brace for the key US inflation data. However, the downside room appears limited.
Trend: Further downside expected
Technical Levels: Supports and Resistances
USDCHF currently trading at 0.9178 at the time of writing. Pair opened at 0.9194 and is trading with a change of -0.17% % .
| Overview | Overview.1 | |
|---|---|---|
| 0 | Today last price | 0.9178 |
| 1 | Today Daily Change | -0.0016 |
| 2 | Today Daily Change % | -0.17% |
| 3 | Today daily open | 0.9194 |
The pair remains strongly bearish on the daily time frame. It trades below the 20 SMA @ 0.9203, 50 SMA 0.9262, 100 SMA @ 0.9517 and 200 SMA @ 0.9601.
| Trends | Trends.1 | |
|---|---|---|
| 0 | Daily SMA20 | 0.9203 |
| 1 | Daily SMA50 | 0.9262 |
| 2 | Daily SMA100 | 0.9517 |
| 3 | Daily SMA200 | 0.9601 |
The previous day high was 0.926 while the previous day low was 0.9191. The daily 38.2% Fib levels comes at 0.9218, expected to provide resistance. Similarly, the daily 61.8% fib level is at 0.9234, expected to provide resistance.
Note the levels of interest below:
- Pivot support is noted at 0.917, 0.9146, 0.9102
- Pivot resistance is noted at 0.9239, 0.9284, 0.9307
| Levels | Levels.1 |
|---|---|
| Previous Daily High | 0.9260 |
| Previous Daily Low | 0.9191 |
| Previous Weekly High | 0.9291 |
| Previous Weekly Low | 0.9160 |
| Previous Monthly High | 0.9410 |
| Previous Monthly Low | 0.9085 |
| Daily Fibonacci 38.2% | 0.9218 |
| Daily Fibonacci 61.8% | 0.9234 |
| Daily Pivot Point S1 | 0.9170 |
| Daily Pivot Point S2 | 0.9146 |
| Daily Pivot Point S3 | 0.9102 |
| Daily Pivot Point R1 | 0.9239 |
| Daily Pivot Point R2 | 0.9284 |
| Daily Pivot Point R3 | 0.9307 |
[/s2If]
Join Our Telegram Group
")


