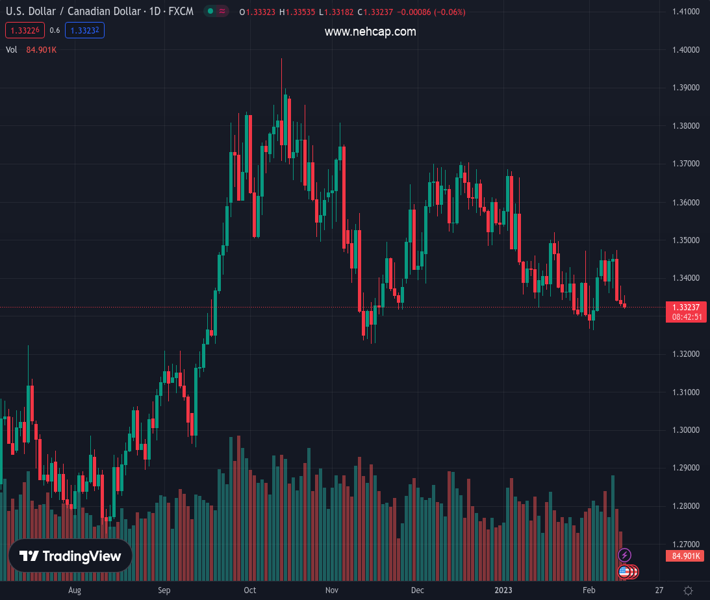
#USDCAD @ 1.33234 drifts into negative territory for the third successive day amid sustained USD selling. (Pivot Orderbook analysis)
…
This is a premium post.
[s2If !current_user_can(access_s2member_level4)]Please register for PREMIUM VERSION HERE to read full post below containing analysis. In case of any error or you think you are not able to read the full post below, please email us at support#nehcap.com [lwa][/s2If] [s2If current_user_can(access_s2member_level4)]
- USD/CAD drifts into negative territory for the third successive day amid sustained USD selling.
- Sliding crude oil prices could undermine the Loonie and help limit the downside for the major.
- Traders might also refrain from placing aggressive bearish bets ahead of the key US CPI report.
The pair currently trades last at 1.33234.
The previous day high was 1.338 while the previous day low was 1.3325. The daily 38.2% Fib levels comes at 1.3346, expected to provide resistance. Similarly, the daily 61.8% fib level is at 1.3359, expected to provide resistance.
The USD/CAD pair meets with a fresh supply following an early uptick to the 1.3355 region and turns lower for the third successive day on Tuesday. The pair drops to a one-and-half-week low, around the 1.3320 region heading into the North American session and is pressured by strong follow-through selling around the US Dollar.
In fact, the USD Index, which tracks the Greenback against a basket of currencies, extends the previous day’s retracement slide from a multi-week high amid a further decline in the US Treasury bond yields. Apart from this, a mildly positive tone around the equity markets is seen as another factor weighing on the safe-haven buck. That said, weaker crude oil prices could undermine the commodity-linked Loonie and help limit the downside for the major, at least for the time being.
Traders might also refrain from placing aggressive bets and prefer to wait on the sidelines ahead of the release of the US consumer inflation figures. The US Labor Department’s annual revisions of CPI data last Friday, which showed that monthly consumer prices rose in December instead of falling as previously estimated, raises the risk of a stronger US CPI print. This, in turn, supports prospects for further policy tightening by the Fed and favours the USD bulls.
Heading into the key US data risk, the aforementioned fundamental backdrop warrants some caution for bearish traders and before positioning for any further depreciating move for the USD/CAD pair. Hence, any subsequent slide is more likely to find decent support and remain limited near the 1.3300 mark. The said handle should act as a pivotal point for intraday traders, which if broken should pave the way for deeper losses and expose the monthly low, around the 1.3260 region.
Technical Levels: Supports and Resistances
USDCAD currently trading at 1.3325 at the time of writing. Pair opened at 1.3336 and is trading with a change of -0.08 % .
| Overview | Overview.1 | |
|---|---|---|
| 0 | Today last price | 1.3325 |
| 1 | Today Daily Change | -0.0011 |
| 2 | Today Daily Change % | -0.0800 |
| 3 | Today daily open | 1.3336 |
The pair is trading below its 20 Daily moving average @ 1.3382, below its 50 Daily moving average @ 1.3487 , below its 100 Daily moving average @ 1.3529 and above its 200 Daily moving average @ 1.3238
| Trends | Trends.1 | |
|---|---|---|
| 0 | Daily SMA20 | 1.3382 |
| 1 | Daily SMA50 | 1.3487 |
| 2 | Daily SMA100 | 1.3529 |
| 3 | Daily SMA200 | 1.3238 |
The previous day high was 1.338 while the previous day low was 1.3325. The daily 38.2% Fib levels comes at 1.3346, expected to provide resistance. Similarly, the daily 61.8% fib level is at 1.3359, expected to provide resistance.
Note the levels of interest below:
- Pivot support is noted at 1.3314, 1.3292, 1.3259
- Pivot resistance is noted at 1.3369, 1.3402, 1.3424
| Levels | Levels.1 |
|---|---|
| Previous Daily High | 1.3380 |
| Previous Daily Low | 1.3325 |
| Previous Weekly High | 1.3476 |
| Previous Weekly Low | 1.3338 |
| Previous Monthly High | 1.3685 |
| Previous Monthly Low | 1.3300 |
| Daily Fibonacci 38.2% | 1.3346 |
| Daily Fibonacci 61.8% | 1.3359 |
| Daily Pivot Point S1 | 1.3314 |
| Daily Pivot Point S2 | 1.3292 |
| Daily Pivot Point S3 | 1.3259 |
| Daily Pivot Point R1 | 1.3369 |
| Daily Pivot Point R2 | 1.3402 |
| Daily Pivot Point R3 | 1.3424 |
[/s2If]
Join Our Telegram Group
")


