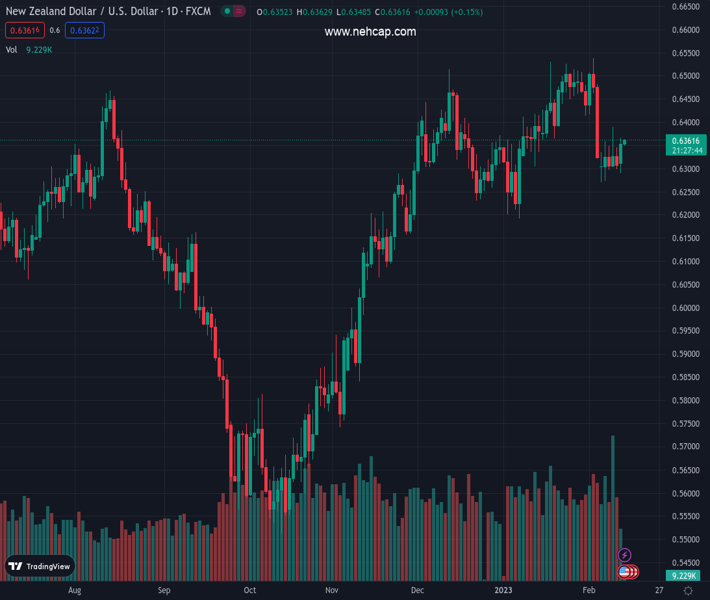
#NZDUSD @ 0.63601 is oscillating around 0.6360 ahead of the US Inflation data. (Pivot Orderbook analysis)
…
This is a premium post.
[s2If !current_user_can(access_s2member_level4)]Please register for PREMIUM VERSION HERE to read full post below containing analysis. In case of any error or you think you are not able to read the full post below, please email us at support#nehcap.com [lwa][/s2If] [s2If current_user_can(access_s2member_level4)]
- NZD/USD is oscillating around 0.6360 ahead of the US Inflation data.
- The Fed is bound to hike interest rates to strengthen its defense against stubborn inflation.
- New Zealand’s monthly Food Price Index has dropped to 1.7% from the consensus of 2.2%.
The pair currently trades last at 0.63601.
The previous day high was 0.6367 while the previous day low was 0.6289. The daily 38.2% Fib levels comes at 0.6337, expected to provide support. Similarly, the daily 61.8% fib level is at 0.6319, expected to provide support.
The NZD/USD pair is demonstrating back-and-forth moves around 0.6360 in the Asian session. The Kiwi asset has turned sideways after a perpendicular upside move as investors are awaiting the release of the United States Consumer Price Index (CPI) data for fresh impetus. The asset is expected to display a power-pack action as any surprise move by the US inflation figure will trigger immense volatility.
The risk profile is extremely positive as risk-sensitive assets like S&P500 displayed solid upside moves on Monday. Investors digested the upside inflation risk as the Federal Reserve (Fed) is bound to hike interest rates to strengthen its defense against stubborn inflation. The US Dollar Index (DXY) is developing its auction below 103.00 as the improved risk appetite of the market participants has trimmed the safe-haven appeal. Meanwhile, the 10-year US Treasury Yields have lost some strength and have dropped to near 3.70%.
The recovery move from the risk-perceived currencies is indicating that investors are not expecting any surprise move from the US inflation. The catalyst that forced street smarts to revise their projections for inflation was the upbeat labor market data. However, consumer spending and the extent of economic activities are still in declining stage. Therefore the inflation figures could land near the estimates.
Analysts at RBC Economics expect CPI growth to edge down to 6.2% in January from 6.5% in December (YoY). Food price growth likely also continued to slow, albeit from very high levels. By contrast, we expect energy price growth to tick up for the first time in 7 months – though to an 8% rate that is still well below a June peak of 42%. We look for core inflation to slow further in January, coming in at 5.4% YoY, down from 5.7% in December. All told, recent inflation reports have pointed to a relatively broadly-based easing in price pressures.”
Meanwhile, the New Zealand Dollar is awaiting the release of the Inflation Expectations (Q1) by the Reserve Bank of New Zealand (RBNZ). The RBNZ could trim its inflation expectations as monthly inflation numbers slowed in December. Also, the Unemployment Rate rose to 3.4% in the fourth quarter of 2022. In early Asia, Statistics New Zealand reported the monthly Food Price Index (Jan) at 1.7%, lower than the consensus of 2.2% but higher than the former release of 1.1%.
Technical Levels: Supports and Resistances
NZDUSD currently trading at 0.6361 at the time of writing. Pair opened at 0.6359 and is trading with a change of 0.03 % .
| Overview | Overview.1 | |
|---|---|---|
| 0 | Today last price | 0.6361 |
| 1 | Today Daily Change | 0.0002 |
| 2 | Today Daily Change % | 0.0300 |
| 3 | Today daily open | 0.6359 |
The pair is trading below its 20 Daily moving average @ 0.6417, below its 50 Daily moving average @ 0.6373 , above its 100 Daily moving average @ 0.6136 and above its 200 Daily moving average @ 0.6187
| Trends | Trends.1 | |
|---|---|---|
| 0 | Daily SMA20 | 0.6417 |
| 1 | Daily SMA50 | 0.6373 |
| 2 | Daily SMA100 | 0.6136 |
| 3 | Daily SMA200 | 0.6187 |
The previous day high was 0.6367 while the previous day low was 0.6289. The daily 38.2% Fib levels comes at 0.6337, expected to provide support. Similarly, the daily 61.8% fib level is at 0.6319, expected to provide support.
Note the levels of interest below:
- Pivot support is noted at 0.631, 0.626, 0.6232
- Pivot resistance is noted at 0.6388, 0.6416, 0.6466
| Levels | Levels.1 |
|---|---|
| Previous Daily High | 0.6367 |
| Previous Daily Low | 0.6289 |
| Previous Weekly High | 0.6391 |
| Previous Weekly Low | 0.6270 |
| Previous Monthly High | 0.6531 |
| Previous Monthly Low | 0.6190 |
| Daily Fibonacci 38.2% | 0.6337 |
| Daily Fibonacci 61.8% | 0.6319 |
| Daily Pivot Point S1 | 0.6310 |
| Daily Pivot Point S2 | 0.6260 |
| Daily Pivot Point S3 | 0.6232 |
| Daily Pivot Point R1 | 0.6388 |
| Daily Pivot Point R2 | 0.6416 |
| Daily Pivot Point R3 | 0.6466 |
[/s2If]
Join Our Telegram Group
")


