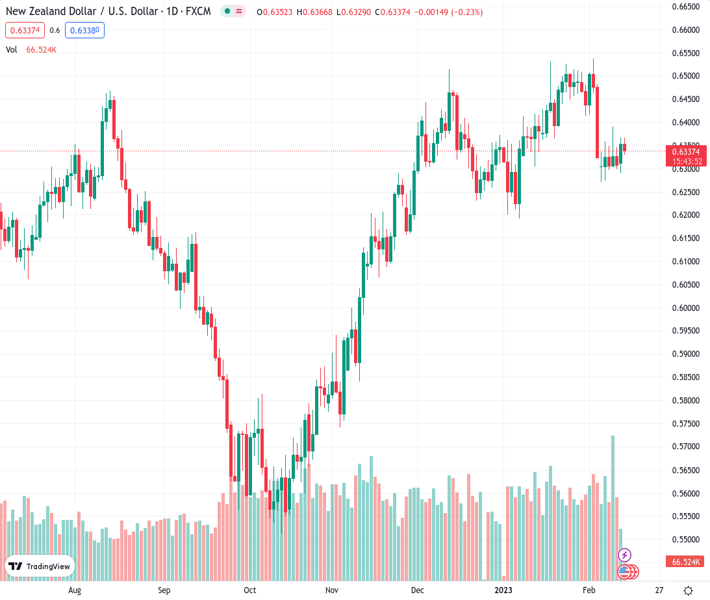
#NZDUSD @ 0.63391 is looking to stretch its recovery move above 0.6350 amid the risk-on mood. (Pivot Orderbook analysis)
…
This is a premium post.
[s2If !current_user_can(access_s2member_level4)]Please register for PREMIUM VERSION HERE to read full post below containing analysis. In case of any error or you think you are not able to read the full post below, please email us at support#nehcap.com [lwa][/s2If] [s2If current_user_can(access_s2member_level4)]
- NZD/USD is looking to stretch its recovery move above 0.6350 amid the risk-on mood.
- Federal Reserve might remain favored for policy tightening continuation despite inflation softening ahead.
- Reserve Bank of New Zealand inflation expectations has dropped to 3.30% from the prior release of 3.62% for two years from now.
- NZD/USD is oscillating in an Inverted Flag that favors the downside on a broader basis.
The pair currently trades last at 0.63391.
The previous day high was 0.6367 while the previous day low was 0.6289. The daily 38.2% Fib levels comes at 0.6337, expected to provide support. Similarly, the daily 61.8% fib level is at 0.6319, expected to provide support.
NZD/USD has rebounded firmly after a corrective move to near 0.6330 in the Asian session. The Kiwi asset is looking to stretch its recovery move above the immediate resistance of 0.6350 as the US Dollar Index (DXY) has extended its downside to near 102.77. Considering the downside pressure in the USD Index ahead of the release of the January inflation report, it is likely that investors are highly confident that the annual Consumer Price Index (CPI) will continue its declining trend consecutively for the seventh time.
S&P500 futures are demonstrating a subdued performance, portraying a minor caution for fresh buying. However, the upside strength shown by the 500-US stocks basket on Monday indicates that the risk appetite theme is extremely solid. The demand for US government bonds is escalating vigorously, which has trimmed the return generated on the 10-year US Treasury yields to 3.70%.
From the whooping figure of 9.1%, the headline inflation in the United States has already come down to 6.5% in January and investors are expecting further decline as higher interest rates have forced the firms to scale down their production activities.
Analysts at RBC Economics expect CPI growth to edge down to 6.2% in January from 6.5% in December (YoY). Food price growth likely also continued to slow, albeit from very high levels. By contrast, we expect energy price growth to tick up for the first time in 7 months – though to an 8% rate that is still well below a June peak of 42%. We look for core inflation to slow further in January, coming in at 5.4% YoY, down from 5.7% in December. All told, recent inflation reports have pointed to a relatively broadly-based easing in price pressures.”
Another school of thought believes that the Consumer Price Index (CPI) could deliver a surprise move as the labor market has remained upbeat in January month. Higher demand for labor is contained by offering them higher wages, which carries the potential of propelling the overall consumer spending as households will be equipped with more funds for disposal.
Meanwhile, the Federal Reserve Bank of New York’s monthly Survey of Consumer Expectations showed on Monday that the US consumers’ one-year inflation expectation stayed unchanged at 5% in January.
The street is laser-focused on the release of the price index data as it will provide meaningful cues for further monetary policy action by the Federal Reserve. Fed chair Jerome Powell has already cleared that inflation is stubborn in nature and a premature consideration of pausing rates or cutting them could paddle up the inflationary pressures again. No doubt, December’s economic indicators were in favor of a policy tightening pause, however, the stronger-than-anticipated US Nonfarm Payrolls (NFP) stole the spotlight.
For interest-rate guidance, Fed Governor Michelle Bowman said on Monday the Fed will continue to raise interest rates, pointing out there will be a lot of data releases between now and the next policy meeting.
The Reserve Bank of New Zealand (RBNZ) has been hiking its Official Cash Rate (OCR) significantly to decelerate the pace of price pressures. After recording a multi-decade high of 7.3%, New Zealand’s inflation dropped marginally to 7.2% in the fourth quarter of CY2022. Led by higher interest rates from Reserve Bank of New Zealand Governor Adrian Orr, employment opportunities have slowed down and the Unemployment Rate has increased to 3.4%. Also, inflation expectations reported by the Reserve Bank of New Zealand have dropped to 3.3% on a quarterly basis from the former release of 3.62% for two years from now.
In spite of the indicators favoring further exhaustion in the inflationary pressures, the Reserve Bank of New Zealand might continue to hike interest rates with a big number. The inflation rate is extremely skewed upside from the desired rate of 2%. Therefore, a decision of bumper interest rate hike cannot be ruled out.
NZD/USD is oscillating in an Inverted Flag chart pattern on a four-hourly scale. The chart pattern indicates a sheer consolidation that is followed by a breakdown. Usually, the consolidation phase of the chart pattern serves as an inventory adjustment in which those participants initiate shorts, which prefer to enter an auction after the establishment of a bearish bias.
The New Zealand Dollar is continuously facing pressure from the 50-period Exponential Moving Average (EMA) at 0.6355, which indicates more weakness ahead.
Meanwhile, the Relative Strength Index (RSI) (14) is oscillating in the 40.00-60.00, which indicates that investors await a potential trigger for a decisive move.
Technical Levels: Supports and Resistances
NZDUSD currently trading at 0.6343 at the time of writing. Pair opened at 0.6359 and is trading with a change of -0.25 % .
| Overview | Overview.1 | |
|---|---|---|
| 0 | Today last price | 0.6343 |
| 1 | Today Daily Change | -0.0016 |
| 2 | Today Daily Change % | -0.2500 |
| 3 | Today daily open | 0.6359 |
The pair is trading below its 20 Daily moving average @ 0.6417, below its 50 Daily moving average @ 0.6373 , above its 100 Daily moving average @ 0.6136 and above its 200 Daily moving average @ 0.6187
| Trends | Trends.1 | |
|---|---|---|
| 0 | Daily SMA20 | 0.6417 |
| 1 | Daily SMA50 | 0.6373 |
| 2 | Daily SMA100 | 0.6136 |
| 3 | Daily SMA200 | 0.6187 |
The previous day high was 0.6367 while the previous day low was 0.6289. The daily 38.2% Fib levels comes at 0.6337, expected to provide support. Similarly, the daily 61.8% fib level is at 0.6319, expected to provide support.
Note the levels of interest below:
- Pivot support is noted at 0.631, 0.626, 0.6232
- Pivot resistance is noted at 0.6388, 0.6416, 0.6466
| Levels | Levels.1 |
|---|---|
| Previous Daily High | 0.6367 |
| Previous Daily Low | 0.6289 |
| Previous Weekly High | 0.6391 |
| Previous Weekly Low | 0.6270 |
| Previous Monthly High | 0.6531 |
| Previous Monthly Low | 0.6190 |
| Daily Fibonacci 38.2% | 0.6337 |
| Daily Fibonacci 61.8% | 0.6319 |
| Daily Pivot Point S1 | 0.6310 |
| Daily Pivot Point S2 | 0.6260 |
| Daily Pivot Point S3 | 0.6232 |
| Daily Pivot Point R1 | 0.6388 |
| Daily Pivot Point R2 | 0.6416 |
| Daily Pivot Point R3 | 0.6466 |
[/s2If]
Join Our Telegram Group
")


