#GBPUSD @ 1.21563 The holds to its early gains in a volatile trading session. (Pivot Orderbook analysis)
…
This is a premium post.
[s2If !current_user_can(access_s2member_level4)]Please register for PREMIUM VERSION HERE to read full post below containing analysis. In case of any error or you think you are not able to read the full post below, please email us at support#nehcap.com [lwa][/s2If] [s2If current_user_can(access_s2member_level4)]
- The GBP/USD holds to its early gains in a volatile trading session.
- US inflation rose above estimates but cooled compared to December’s data.
- GBP/USD Price Analysis: It could resume its uptrend if it conquers 1.2200.
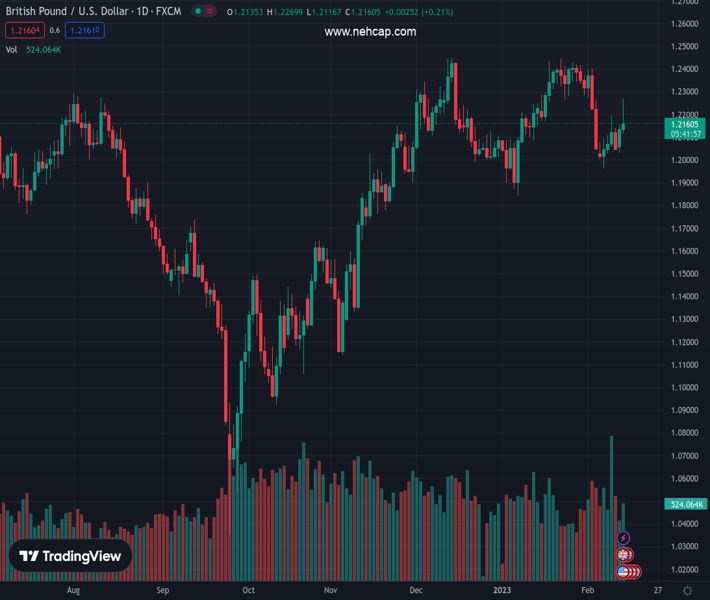
The pair currently trades last at 1.21563.
The previous day high was 1.2152 while the previous day low was 1.2031. The daily 38.2% Fib levels comes at 1.2106, expected to provide support. Similarly, the daily 61.8% fib level is at 1.2077, expected to provide support.
The GBP/USD dropped sharply in the North American session following the release of inflation data in the United States, which, although increased, initially sent the GBP/USD spiking towards its daily high at 1.2269 before reversing its course to the 1.2130 area. However, a late bounce sparked a recovery in the GBP/USD, trading at 1.2166, above its opening price.
US inflation reported by the Department of Labor (DoL) showed that the Consumer Price Index (CPI) for January rose by 6.4% YoY, above estimates of 6.2%, while core CPI jumped to 5.6% YoY, against data estimated at 5.5%. Monthly basis readings were in line with estimates.
After the data release, US Treasury bond yields advanced, with the US 2-year Treasury bond yield edging towards 4.622%, as an initial reaction to the data, which warrants further tightening by the US Federal Reserve (Fed). Consequently, the greenback advanced, with the US Dollar Index (DXY) peaking at around 103.83 before reversing its course, toward the 103.09 area.
In the meantime, the swaps markets estimate the Fed would hike rates until the 5%-5.25% range, and then some cuts are expected by the end of the year.
Across the pond, data from the United Kingdom (UK), capped the Pound Sterling (GBP) fall vs. the US Dollar (USD). According to Reuters, wages in Britain grew quickly in the last quarter of 2022, keeping the Bank of England (BoE), pressured. Investors increased “slightly” their bets that the BoE would raise rates by 25 bps at their March meeting.
Elsewhere, Fed officials led by Thomas Barkin from the Richmond Fed are crossing the wires. Commented that the inflation report was “about as expected,” adding that inflation, although normalizing, it’s doing it slowly. Therefore, Barkin said there’s a good cause for leaving rates higher for a longer period.
From a technical perspective, the GBP/USD daily chart suggests the pair is neutral to upward biased. Upward continuation will resume if the GBP/USD clears the 1.2200 figure, which could lift the major towards the February high of 1.2401. Firstly, it needs to hurdle the psychological 1.2300 barrier. On the flip side, a GBP/USD fall underneath the 20-day EMA at 1.2179 would expose the confluence of the 200/50-day EMA at 1.2136/1.2128, respectively, ahead of falling to 1.21000.
Technical Levels: Supports and Resistances
GBPUSD currently trading at 1.2205 at the time of writing. Pair opened at 1.2138 and is trading with a change of 0.55 % .
| Overview | Overview.1 | |
|---|---|---|
| 0 | Today last price | 1.2205 |
| 1 | Today Daily Change | 0.0067 |
| 2 | Today Daily Change % | 0.5500 |
| 3 | Today daily open | 1.2138 |
The pair is trading below its 20 Daily moving average @ 1.2254, above its 50 Daily moving average @ 1.2186 , above its 100 Daily moving average @ 1.1859 and above its 200 Daily moving average @ 1.1944
| Trends | Trends.1 | |
|---|---|---|
| 0 | Daily SMA20 | 1.2254 |
| 1 | Daily SMA50 | 1.2186 |
| 2 | Daily SMA100 | 1.1859 |
| 3 | Daily SMA200 | 1.1944 |
The previous day high was 1.2152 while the previous day low was 1.2031. The daily 38.2% Fib levels comes at 1.2106, expected to provide support. Similarly, the daily 61.8% fib level is at 1.2077, expected to provide support.
Note the levels of interest below:
- Pivot support is noted at 1.2062, 1.1986, 1.1941
- Pivot resistance is noted at 1.2183, 1.2228, 1.2304
| Levels | Levels.1 |
|---|---|
| Previous Daily High | 1.2152 |
| Previous Daily Low | 1.2031 |
| Previous Weekly High | 1.2194 |
| Previous Weekly Low | 1.1961 |
| Previous Monthly High | 1.2448 |
| Previous Monthly Low | 1.1841 |
| Daily Fibonacci 38.2% | 1.2106 |
| Daily Fibonacci 61.8% | 1.2077 |
| Daily Pivot Point S1 | 1.2062 |
| Daily Pivot Point S2 | 1.1986 |
| Daily Pivot Point S3 | 1.1941 |
| Daily Pivot Point R1 | 1.2183 |
| Daily Pivot Point R2 | 1.2228 |
| Daily Pivot Point R3 | 1.2304 |
[/s2If]
Join Our Telegram Group
")


