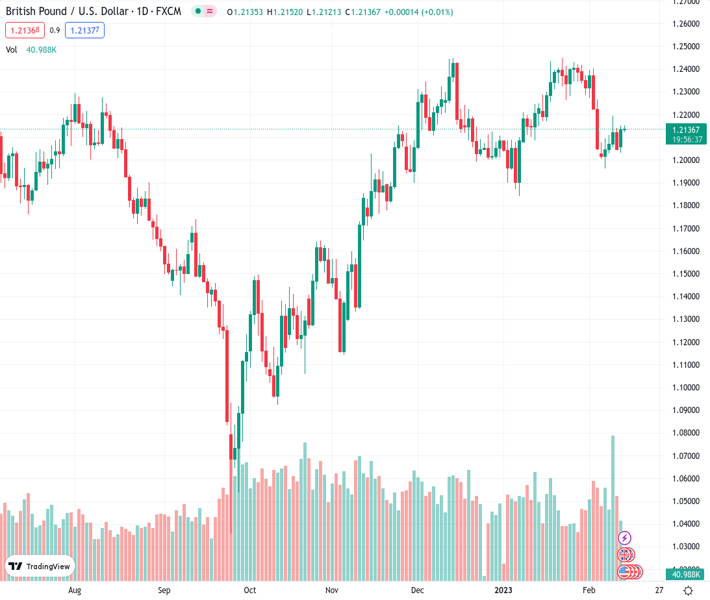
#GBPUSD @ 1.21368 is hovering near the edge of the Symmetrical Triangle pattern for a breakout. (Pivot Orderbook analysis)
…
This is a premium post.
[s2If !current_user_can(access_s2member_level4)]Please register for PREMIUM VERSION HERE to read full post below containing analysis. In case of any error or you think you are not able to read the full post below, please email us at support#nehcap.com [lwa][/s2If] [s2If current_user_can(access_s2member_level4)]
- GBP/USD is hovering near the edge of the Symmetrical Triangle pattern for a breakout.
- Economic events such as the US Inflation and the UK employment data might keep Cable volatile.
- The RSI (14) is oscillating in the bullish range of 60.00-80.00, which indicates that the upside momentum is already active.
The pair currently trades last at 1.21368.
The previous day high was 1.2152 while the previous day low was 1.2031. The daily 38.2% Fib levels comes at 1.2106, expected to provide support. Similarly, the daily 61.8% fib level is at 1.2077, expected to provide support.
The GBP/USD pair has refreshed its day’s high above the critical resistance of 1.2150 in the Asian session. The Cable has picked strength amid the improved risk appetite of investors after they digested the United States inflation-inspired anxiety.
S&P500 futures are displaying a subdued performance after a bullish Monday, portraying a minor caution amid overall positive sentiment. The US Dollar Index (DXY) has further dropped below 102.85, showing a sheer decline in the safe-haven’s appeal. The Pound Sterling will display a power-pack action after the release of the United Kingdom employment data.
GBP/USD is hovering near the edge of the Symmetrical Triangle chart pattern formed on an hourly scale. The upward-sloping trendline of the aforementioned chart pattern is placed from February 7 low at 1.1961 while the downward-sloping trendline is plotted from February 3 high at 1.2264.
Advancing 20-period Exponential Moving Average (EMA) at 1.2118, adds to the upside filters.
The Relative Strength Index (RSI) (14) is oscillating in the bullish range of 60.00-80.00, which indicates that the upside momentum is already active.
A confident breakout of the Symmetrical Triangle above February 9 high at 1.2192 will trigger the volatility expansion, which will drive the asset toward February 3 high at 1.2264. A breach of the latter will expose the asset to the round-level resistance of 1.2300.
On the contrary, a decline in the Cable below February 9 low at 1.2057 will drag the asset toward January 3 low at 1.1900 followed by horizontal support placed from January 6 low around 1.1841.
Technical Levels: Supports and Resistances
GBPUSD currently trading at 1.215 at the time of writing. Pair opened at 1.2138 and is trading with a change of 0.1 % .
| Overview | Overview.1 | |
|---|---|---|
| 0 | Today last price | 1.2150 |
| 1 | Today Daily Change | 0.0012 |
| 2 | Today Daily Change % | 0.1000 |
| 3 | Today daily open | 1.2138 |
The pair is trading below its 20 Daily moving average @ 1.2254, below its 50 Daily moving average @ 1.2186 , above its 100 Daily moving average @ 1.1859 and above its 200 Daily moving average @ 1.1944
| Trends | Trends.1 | |
|---|---|---|
| 0 | Daily SMA20 | 1.2254 |
| 1 | Daily SMA50 | 1.2186 |
| 2 | Daily SMA100 | 1.1859 |
| 3 | Daily SMA200 | 1.1944 |
The previous day high was 1.2152 while the previous day low was 1.2031. The daily 38.2% Fib levels comes at 1.2106, expected to provide support. Similarly, the daily 61.8% fib level is at 1.2077, expected to provide support.
Note the levels of interest below:
- Pivot support is noted at 1.2062, 1.1986, 1.1941
- Pivot resistance is noted at 1.2183, 1.2228, 1.2304
| Levels | Levels.1 |
|---|---|
| Previous Daily High | 1.2152 |
| Previous Daily Low | 1.2031 |
| Previous Weekly High | 1.2194 |
| Previous Weekly Low | 1.1961 |
| Previous Monthly High | 1.2448 |
| Previous Monthly Low | 1.1841 |
| Daily Fibonacci 38.2% | 1.2106 |
| Daily Fibonacci 61.8% | 1.2077 |
| Daily Pivot Point S1 | 1.2062 |
| Daily Pivot Point S2 | 1.1986 |
| Daily Pivot Point S3 | 1.1941 |
| Daily Pivot Point R1 | 1.2183 |
| Daily Pivot Point R2 | 1.2228 |
| Daily Pivot Point R3 | 1.2304 |
[/s2If]
Join Our Telegram Group
")


