#EURUSD @ 1.07318 extends the previous day’s rebound from five-week low, grinds higher of late., @nehcap view: Further upside expected (Pivot Orderbook analysis)
…
This is a premium post.
[s2If !current_user_can(access_s2member_level4)]Please register for PREMIUM VERSION HERE to read full post below containing analysis. In case of any error or you think you are not able to read the full post below, please email us at support#nehcap.com [lwa][/s2If] [s2If current_user_can(access_s2member_level4)]
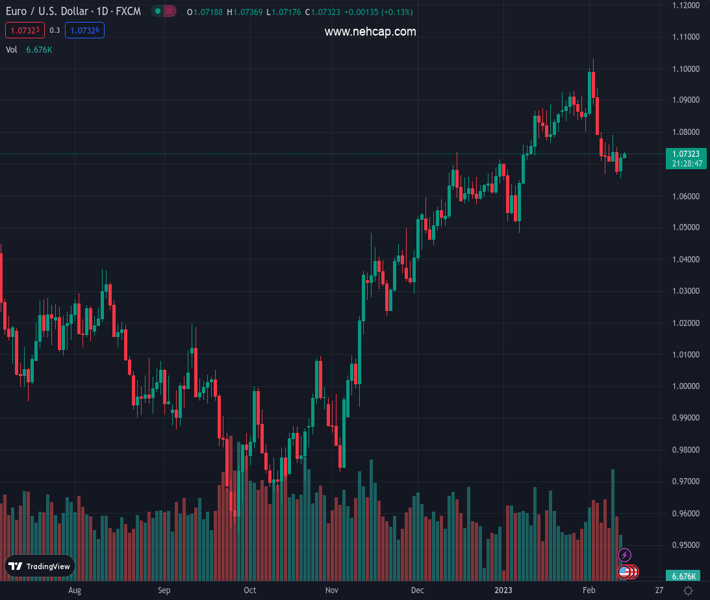
- EUR/USD extends the previous day’s rebound from five-week low, grinds higher of late.
- Sustained break of descending triangle, upbeat oscillators favor buyers to target 200-SMA.
- Sellers need validation from 1.0650 to retake control.
The pair currently trades last at 1.07318.
The previous day high was 1.073 while the previous day low was 1.0656. The daily 38.2% Fib levels comes at 1.0702, expected to provide support. Similarly, the daily 61.8% fib level is at 1.0684, expected to provide support.
EUR/USD grinds near the intraday high of 1.0736 while stretching the week-start rebound from the multi-day low to early Tuesday. In doing so, the major currency pair justifies the previous day’s upside break of a two-week-old descending triangle.
Adding strength to the upside bias are the bullish MACD signals and the firmer RSI (14), not overbought.
With this, the EUR/USD buyers are on the way to the 200-bar Simple Moving Average (SMA), around 1.0780 by the press time. However, multiple hurdles could challenge the pair’s further upside near 1.0800 and 1.0870 afterward.
In a case where the EUR/USD pair remains firmer past 1.0870, a three-week-old horizontal resistance area near 1.0930-40 will be crucial for the buyers to cross if they wish to keep the reins.
On the flip side, the pullback moves remain elusive unless the quote stays beyond the stated triangle’s top line, near 1.0680 at the latest.
Even if the EUR/USD pair declines below 1.0680, the lower line of the triangle, close to 1.0650, could act as the last defense of the buyers.
Overall, EUR/USD is likely to remain firmer as crucial statistics from the Eurozone and the US loom. However, the upside room appears limited.
Also read: EUR/USD grinds higher past 1.0700 as traders brace for EU Q4 GDP, US inflation
Trend: Further upside expected
Technical Levels: Supports and Resistances
EURUSD currently trading at 1.0732 at the time of writing. Pair opened at 1.0723 and is trading with a change of 0.08% % .
| Overview | Overview.1 | |
|---|---|---|
| 0 | Today last price | 1.0732 |
| 1 | Today Daily Change | 0.0009 |
| 2 | Today Daily Change % | 0.08% |
| 3 | Today daily open | 1.0723 |
The pair is trading below its 20 Daily moving average @ 1.082, above its 50 Daily moving average @ 1.0711 , above its 100 Daily moving average @ 1.0374 and above its 200 Daily moving average @ 1.0324
| Trends | Trends.1 | |
|---|---|---|
| 0 | Daily SMA20 | 1.0820 |
| 1 | Daily SMA50 | 1.0711 |
| 2 | Daily SMA100 | 1.0374 |
| 3 | Daily SMA200 | 1.0324 |
The previous day high was 1.073 while the previous day low was 1.0656. The daily 38.2% Fib levels comes at 1.0702, expected to provide support. Similarly, the daily 61.8% fib level is at 1.0684, expected to provide support.
Note the levels of interest below:
- Pivot support is noted at 1.0676, 1.0628, 1.0601
- Pivot resistance is noted at 1.075, 1.0777, 1.0825
| Levels | Levels.1 |
|---|---|
| Previous Daily High | 1.0730 |
| Previous Daily Low | 1.0656 |
| Previous Weekly High | 1.0799 |
| Previous Weekly Low | 1.0666 |
| Previous Monthly High | 1.0930 |
| Previous Monthly Low | 1.0483 |
| Daily Fibonacci 38.2% | 1.0702 |
| Daily Fibonacci 61.8% | 1.0684 |
| Daily Pivot Point S1 | 1.0676 |
| Daily Pivot Point S2 | 1.0628 |
| Daily Pivot Point S3 | 1.0601 |
| Daily Pivot Point R1 | 1.0750 |
| Daily Pivot Point R2 | 1.0777 |
| Daily Pivot Point R3 | 1.0825 |
[/s2If]
Join Our Telegram Group
")


