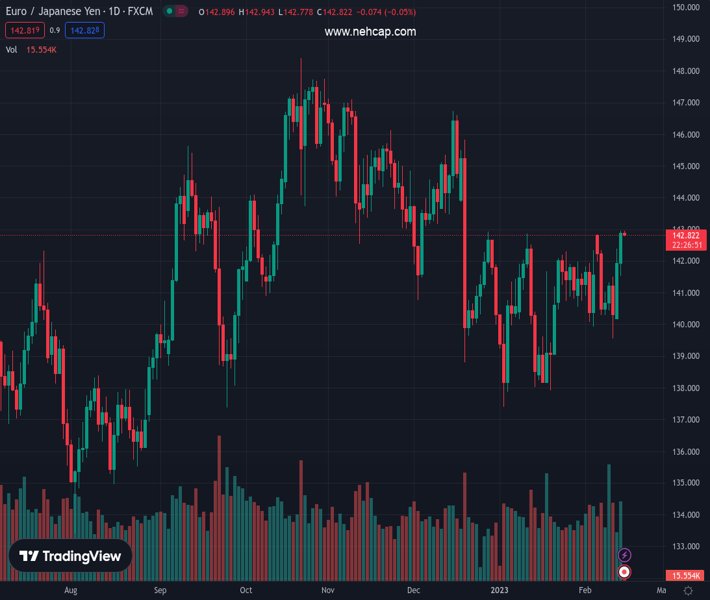
#EURJPY @ 142.804 printed a fresh YTD high and approached the 143.00 mark. (Pivot Orderbook analysis)
…
This is a premium post.
[s2If !current_user_can(access_s2member_level4)]Please register for PREMIUM VERSION HERE to read full post below containing analysis. In case of any error or you think you are not able to read the full post below, please email us at support#nehcap.com [lwa][/s2If] [s2If current_user_can(access_s2member_level4)]
- EUR/JPY printed a fresh YTD high and approached the 143.00 mark.
- EUR/JPY Price Analysis: Turned bullish bias after cracking the February 13 daily high of 142.38.
The pair currently trades last at 142.804.
The previous day high was 142.38 while the previous day low was 140.19. The daily 38.2% Fib levels comes at 141.55, expected to provide support. Similarly, the daily 61.8% fib level is at 141.03, expected to provide support.
The EUR/JPY extends its weekly gains to two straight days and hit a fresh YTD high at 142.94 before trimming some of Tuesday’s gains. As Wednesday’s Asian session begins, the EUR/JPY exchanges hands at 142.85, below its opening price by a minuscule 0.03%.
After the EUR/JPY failed to crack below the YTD low of 137.38, the EUR/JPY enjoyed a bounce, which lifted the pair towards its YTD high of 142.94. Even though it took almost one and a half months, the EUR/JPY pair shifted to a neutral-bullish biased, meaning that further upside is expected.
If the EUR/JPY clears 143.00, the next resistance would be the psychological 144.00 figure, ahead of the December 20 swing high at 145.83. As an alternate scenario, the EUR/JPY first support would be the February 13 daily high of 142.38, ahead of the 142.00 price level. A decisive break and the pair might fall towards a busy confluence area of the 100/50/20-day Exponential Moving Averages (EMAs), each at 141.73, 141.62, and 141.40, respectively, ahead of the 200-day EMA at 140.38.
Oscillators like the Relative Strength Index (RSI) aim higher, while the Rate of Change (RoC) indicates that buyers are gathering momentum. Therefore, the first above-mentioned scenario it’s most likely to pan out.
Technical Levels: Supports and Resistances
EURJPY currently trading at 142.87 at the time of writing. Pair opened at 141.85 and is trading with a change of 0.72 % .
| Overview | Overview.1 | |
|---|---|---|
| 0 | Today last price | 142.87 |
| 1 | Today Daily Change | 1.02 |
| 2 | Today Daily Change % | 0.72 |
| 3 | Today daily open | 141.85 |
The pair is trading above its 20 Daily moving average @ 140.95, above its 50 Daily moving average @ 141.54 , below its 100 Daily moving average @ 142.98 and above its 200 Daily moving average @ 141.1
| Trends | Trends.1 | |
|---|---|---|
| 0 | Daily SMA20 | 140.95 |
| 1 | Daily SMA50 | 141.54 |
| 2 | Daily SMA100 | 142.98 |
| 3 | Daily SMA200 | 141.10 |
The previous day high was 142.38 while the previous day low was 140.19. The daily 38.2% Fib levels comes at 141.55, expected to provide support. Similarly, the daily 61.8% fib level is at 141.03, expected to provide support.
Note the levels of interest below:
- Pivot support is noted at 140.57, 139.28, 138.37
- Pivot resistance is noted at 142.76, 143.67, 144.96
| Levels | Levels.1 |
|---|---|
| Previous Daily High | 142.38 |
| Previous Daily Low | 140.19 |
| Previous Weekly High | 142.88 |
| Previous Weekly Low | 139.55 |
| Previous Monthly High | 142.86 |
| Previous Monthly Low | 137.39 |
| Daily Fibonacci 38.2% | 141.55 |
| Daily Fibonacci 61.8% | 141.03 |
| Daily Pivot Point S1 | 140.57 |
| Daily Pivot Point S2 | 139.28 |
| Daily Pivot Point S3 | 138.37 |
| Daily Pivot Point R1 | 142.76 |
| Daily Pivot Point R2 | 143.67 |
| Daily Pivot Point R3 | 144.96 |
[/s2If]
Join Our Telegram Group
")


