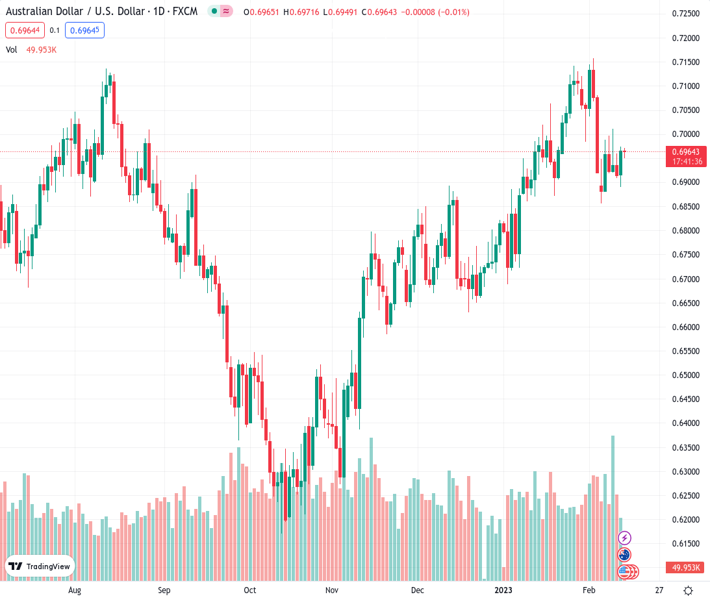
#AUDUSD @ 0.69639 has corrected marginally to near 0.6950, however, the upside looks favored. (Pivot Orderbook analysis)
…
This is a premium post.
[s2If !current_user_can(access_s2member_level4)]Please register for PREMIUM VERSION HERE to read full post below containing analysis. In case of any error or you think you are not able to read the full post below, please email us at support#nehcap.com [lwa][/s2If] [s2If current_user_can(access_s2member_level4)]
- AUD/USD has corrected marginally to near 0.6950, however, the upside looks favored.
- The upward-sloping trendline placed from 0.6629 is providing a cushion to the Australian Dollar.
- A 40.00-60.00 range oscillation by the RSI (14) indicates an absence of a potential trigger.
The pair currently trades last at 0.69639.
The previous day high was 0.6974 while the previous day low was 0.6891. The daily 38.2% Fib levels comes at 0.6942, expected to provide support. Similarly, the daily 61.8% fib level is at 0.6922, expected to provide support.
The AUD/USD pair is looking for demand after a minor correction to near 0.6950 in the Tokyo session. The Aussie asset is expected to display a sideways auction as investors are awaiting the release of the US Inflation for fresh impetus. The US Dollar Index (DXY) is not demonstrating any action as the inflation data might surprise investors.
A mix of indicators in their December report called for further inflation softening, however, January’s upbeat Nonfarm Payrolls (NFP) data has dampened the expectations of further deceleration in the living cost index. S&P500 futures have recovered some losses reported in the Asian session, indicating that the risk appetite is recovering again.
The Australian Dollar will display action after the speech from Reserve Bank of Australia (RBA) Governor Philip Lowe, which is scheduled for Wednesday.
AUD/USD has rebounded after sensing firmer buying interest around the upward-sloping trendline placed from December 20 low at 0.6629 on a four-hour scale. The movement in the Aussie asset has bounded in the 0.6886-0.6992 range, portraying a sheer contraction in volatility.
The 50-period Exponential Moving Average (EMA) at around 0.6960 is acting as a major barricade for the Australian Dollar.
Meanwhile, the Relative Strength Index (RSI) (14) is oscillating in the 40.00-60.00, which indicates that investors await a potential trigger for a decisive move.
A breakdown below January 10 low at 0.6860 will drag the asset toward December 28 high around 0.6800. A slippage below the latter will further drag the asset toward December 22 high at 0.6767.
In an alternate scenario, a decisive break above the psychological resistance of 0.7000 will drive the asset towards January 18 high at 0.7064 followed by January 26 high at 0.7143.
Technical Levels: Supports and Resistances
AUDUSD currently trading at 0.6955 at the time of writing. Pair opened at 0.6966 and is trading with a change of -0.16 % .
| Overview | Overview.1 | |
|---|---|---|
| 0 | Today last price | 0.6955 |
| 1 | Today Daily Change | -0.0011 |
| 2 | Today Daily Change % | -0.1600 |
| 3 | Today daily open | 0.6966 |
The pair is trading below its 20 Daily moving average @ 0.7002, above its 50 Daily moving average @ 0.6874 , above its 100 Daily moving average @ 0.6689 and above its 200 Daily moving average @ 0.6806
| Trends | Trends.1 | |
|---|---|---|
| 0 | Daily SMA20 | 0.7002 |
| 1 | Daily SMA50 | 0.6874 |
| 2 | Daily SMA100 | 0.6689 |
| 3 | Daily SMA200 | 0.6806 |
The previous day high was 0.6974 while the previous day low was 0.6891. The daily 38.2% Fib levels comes at 0.6942, expected to provide support. Similarly, the daily 61.8% fib level is at 0.6922, expected to provide support.
Note the levels of interest below:
- Pivot support is noted at 0.6913, 0.686, 0.683
- Pivot resistance is noted at 0.6997, 0.7027, 0.708
| Levels | Levels.1 |
|---|---|
| Previous Daily High | 0.6974 |
| Previous Daily Low | 0.6891 |
| Previous Weekly High | 0.7011 |
| Previous Weekly Low | 0.6856 |
| Previous Monthly High | 0.7143 |
| Previous Monthly Low | 0.6688 |
| Daily Fibonacci 38.2% | 0.6942 |
| Daily Fibonacci 61.8% | 0.6922 |
| Daily Pivot Point S1 | 0.6913 |
| Daily Pivot Point S2 | 0.6860 |
| Daily Pivot Point S3 | 0.6830 |
| Daily Pivot Point R1 | 0.6997 |
| Daily Pivot Point R2 | 0.7027 |
| Daily Pivot Point R3 | 0.7080 |
[/s2If]
Join Our Telegram Group
")


