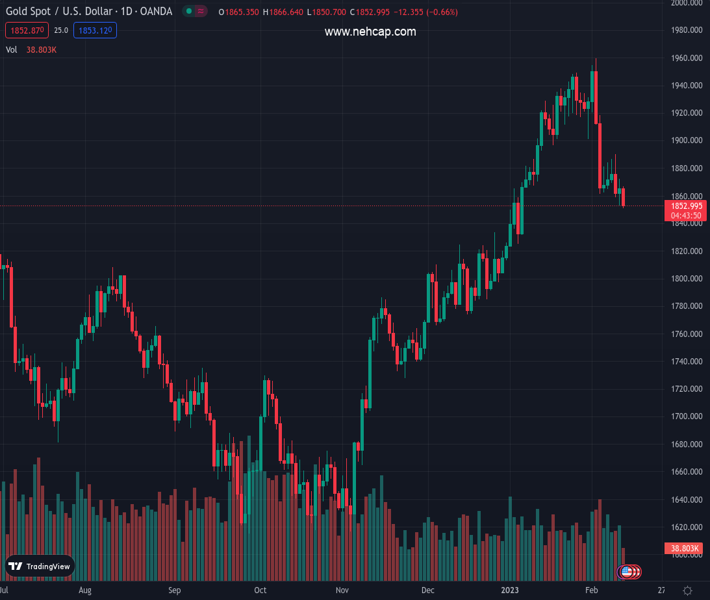
#XAUUSD @ 1,853.09 Gold dives to five-week lows at around $1850 as bears eye the 100-DMA beneath $1820. (Pivot Orderbook analysis)
…
This is a premium post.
[s2If !current_user_can(access_s2member_level4)]Please register for PREMIUM VERSION HERE to read full post below containing analysis. In case of any error or you think you are not able to read the full post below, please email us at support#nehcap.com [lwa][/s2If] [s2If current_user_can(access_s2member_level4)]
- Gold dives to five-week lows at around $1850 as bears eye the 100-DMA beneath $1820.
- Market participants are eyeing Tuesday’s US CPI data, which could reaffirm the disinflation process has already started.
- XAU/USD Price Analysis: A daily close below $1850 would pave the way toward $1820.
The pair currently trades last at 1853.09.
The previous day high was 1872.33 while the previous day low was 1852.84. The daily 38.2% Fib levels comes at 1864.88, expected to provide resistance. Similarly, the daily 61.8% fib level is at 1860.29, expected to provide resistance.
Gold price retreated from last Friday’s highs of $1872.22 and dropped toward the $1850 area on Monday despite the US Dollar (USD) fall, ahead of a vital inflation report from the United States (US). Additionally, US Treasury yields, albeit edging down, remain at around five-week highs. At the time of writing, the XAU/USD is trading at $1852.88.
XAU/USD remains pressured, while the US Dollar Index, a measure of the buck’s value vs. a basket of peers, drops 0.18%, down at 103.391, undermined by the US 10-year Treasury bond yield, with the 10-year benchmark not dropping one and a half bps to 3.726%.
Investors are awaiting a report from the Bureau of Labor Statistics (BLS) on Tuesday, revealing the Consumer Price Index (CPI) for January, estimated at 6.2% YoY, lower than the 6.5% in December. The core CPI excludes volatile items like food and energy, which is foreseen at 5.5% YoY, from 5.7% in the previous month.
In the meantime, Fed hawkish commentary continued with the Fed Governor Michell Bownman, who said that the Federal Reserve (Fed) needs to continue to raise rates to get the Federal Funds Rate(FFR) to a sufficiently restrictive level, as the US central bank battles high inflationary pressures.
Of late, the US Federal Reserve of New York revealed inflation expectations for the year hold steady at 5%. For a three-year horizon, the poll showed that inflation would stand at 2.7%, down from December 2.9%, while for a five-year span, it was projected at 2.5%, vs. 2.4 in the prior month.
Technically speaking, XAU/USD remains neutral to slightly downward biased. At the time of typing, the yellow metal falls beneath the 50-day Exponential Moving Average (EMA) At $1856.58, exacerbating further selling pressure. On the downside, the following support levels would be the December 26 daily high of 1833.29 turned support, followed by the 100-day EMA at 1817.77, and the confluence of the 200-day EMA, and the figure at $1800.
Technical Levels: Supports and Resistances
XAUUSD currently trading at 1852.67 at the time of writing. Pair opened at 1864.33 and is trading with a change of -0.63 % .
| Overview | Overview.1 | |
|---|---|---|
| 0 | Today last price | 1852.67 |
| 1 | Today Daily Change | -11.66 |
| 2 | Today Daily Change % | -0.63 |
| 3 | Today daily open | 1864.33 |
The pair is trading below its 20 Daily moving average @ 1909.06, below its 50 Daily moving average @ 1855.63 , above its 100 Daily moving average @ 1776.55 and above its 200 Daily moving average @ 1775.81
| Trends | Trends.1 | |
|---|---|---|
| 0 | Daily SMA20 | 1909.06 |
| 1 | Daily SMA50 | 1855.63 |
| 2 | Daily SMA100 | 1776.55 |
| 3 | Daily SMA200 | 1775.81 |
The previous day high was 1872.33 while the previous day low was 1852.84. The daily 38.2% Fib levels comes at 1864.88, expected to provide resistance. Similarly, the daily 61.8% fib level is at 1860.29, expected to provide resistance.
Note the levels of interest below:
- Pivot support is noted at 1854.0, 1843.68, 1834.51
- Pivot resistance is noted at 1873.49, 1882.66, 1892.98
| Levels | Levels.1 |
|---|---|
| Previous Daily High | 1872.33 |
| Previous Daily Low | 1852.84 |
| Previous Weekly High | 1890.27 |
| Previous Weekly Low | 1852.84 |
| Previous Monthly High | 1949.27 |
| Previous Monthly Low | 1823.76 |
| Daily Fibonacci 38.2% | 1864.88 |
| Daily Fibonacci 61.8% | 1860.29 |
| Daily Pivot Point S1 | 1854.00 |
| Daily Pivot Point S2 | 1843.68 |
| Daily Pivot Point S3 | 1834.51 |
| Daily Pivot Point R1 | 1873.49 |
| Daily Pivot Point R2 | 1882.66 |
| Daily Pivot Point R3 | 1892.98 |
[/s2If]
Join Our Telegram Group
")


