#USDMXN @ 18.6212 Long-term, the remains downward biased, as it got rejected at the 50-hour EMA. (Pivot Orderbook analysis)
…
This is a premium post.
[s2If !current_user_can(access_s2member_level4)]Please register for PREMIUM VERSION HERE to read full post below containing analysis. In case of any error or you think you are not able to read the full post below, please email us at support#nehcap.com [lwa][/s2If] [s2If current_user_can(access_s2member_level4)]
- Long-term, the USD/MXN remains downward biased, as it got rejected at the 50-hour EMA.
- USD/MXN, on an intraday basis, formed a falling wedge, suggesting that buyers are gathering momentum.
The pair currently trades last at 18.6212.
The previous day high was 18.8318 while the previous day low was 18.639. The daily 38.2% Fib levels comes at 18.7127, expected to provide resistance. Similarly, the daily 61.8% fib level is at 18.7582, expected to provide resistance.
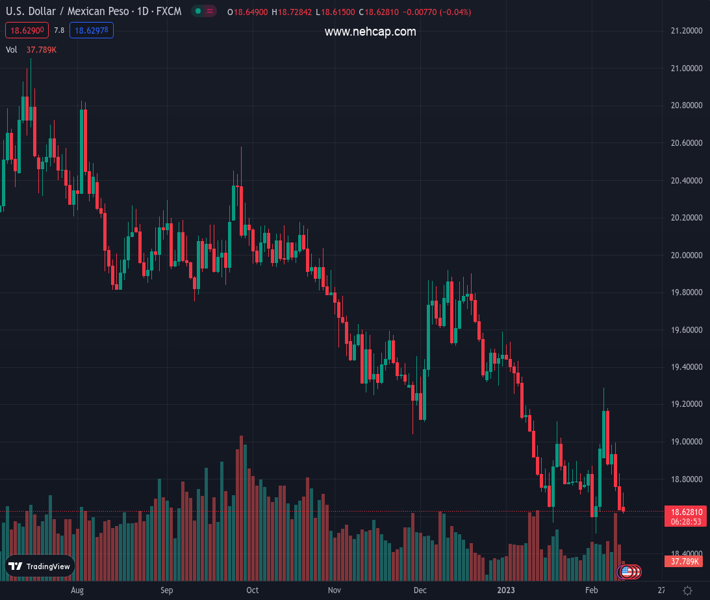
The USD/MXN recovered some ground on Monday after last week’s Banxico decision to raise rates by 50 basis points (bps) interest rates to the 11% threshold spurred a bid in the Mexican Peso (MXN). At the time of writing, the USD/MXN exchanges hands at 18.6517, above its opening price by a slight margin of 0.03%.
From a daily chart perspective, the USD/MXN is still downward biased, as the daily moving averages (MAs) remain above the spot price. Even though the USD/MXN paired some of last Friday’s losses, the USD/MXN pair remains under selling pressure, and it could shift neutral if the USD/MXN breaks resistance at the 50-day Exponential Moving Average (EMA) at 19.0805.
Oscillators like the Relative Strength Index (RSI) point downwards and in bearish territory, so further downside is expected.
On an intraday basis, the USD/MXN 1-hour chart suggests the pair might consolidate in the 18.50-19.00 area, unable to crack support/resistance levels.
A falling wedge is forming as the pair bottoms at around the $18.60 area, which would exacerbate an upward move in the USD/MXN, though there are some key resistance levels that buyers need to battle, to lift the USD/MXN exchange rate towards $19.00.
A break above the 20-period Exponential Moving Average (EMA) at 18.6768 would send the USD/MXN pair toward 18.7336., which, once cleared, would open the door for further gains toward the 100-EMA at 18.7945 and the 200-EMA at 18.8273.
USD/MXN 1-Hour chart
USD/MXN Key technical levels
Technical Levels: Supports and Resistances
USDMXN currently trading at 18.6457 at the time of writing. Pair opened at 18.6576 and is trading with a change of -0.06 % .
| Overview | Overview.1 | |
|---|---|---|
| 0 | Today last price | 18.6457 |
| 1 | Today Daily Change | -0.0119 |
| 2 | Today Daily Change % | -0.0600 |
| 3 | Today daily open | 18.6576 |
The pair remains strongly bearish on the daily time frame. It trades below the 20 SMA @ 18.8225, 50 SMA 19.2093, 100 SMA @ 19.4759 and 200 SMA @ 19.8051.
| Trends | Trends.1 | |
|---|---|---|
| 0 | Daily SMA20 | 18.8225 |
| 1 | Daily SMA50 | 19.2093 |
| 2 | Daily SMA100 | 19.4759 |
| 3 | Daily SMA200 | 19.8051 |
The previous day high was 18.8318 while the previous day low was 18.639. The daily 38.2% Fib levels comes at 18.7127, expected to provide resistance. Similarly, the daily 61.8% fib level is at 18.7582, expected to provide resistance.
Note the levels of interest below:
- Pivot support is noted at 18.5871, 18.5167, 18.3943
- Pivot resistance is noted at 18.7799, 18.9023, 18.9727
| Levels | Levels.1 |
|---|---|
| Previous Daily High | 18.8318 |
| Previous Daily Low | 18.6390 |
| Previous Weekly High | 19.2901 |
| Previous Weekly Low | 18.6390 |
| Previous Monthly High | 19.5361 |
| Previous Monthly Low | 18.5663 |
| Daily Fibonacci 38.2% | 18.7127 |
| Daily Fibonacci 61.8% | 18.7582 |
| Daily Pivot Point S1 | 18.5871 |
| Daily Pivot Point S2 | 18.5167 |
| Daily Pivot Point S3 | 18.3943 |
| Daily Pivot Point R1 | 18.7799 |
| Daily Pivot Point R2 | 18.9023 |
| Daily Pivot Point R3 | 18.9727 |
[/s2If]
Join Our Telegram Group
")


