WTI is registering solid gains of 0.43% on Wednesday. (Pivot Orderbook analysis)
…
This is a premium post.
[s2If !current_user_can(access_s2member_level4)]Please register for PREMIUM VERSION HERE to read full post below containing analysis. In case of any error or you think you are not able to read the full post below, please email us at support#nehcap.com [lwa][/s2If] [s2If current_user_can(access_s2member_level4)]
- WTI is registering solid gains of 0.43% on Wednesday.
- Less hawkish comments by Fed Chair Jerome Powell underpinned oil prices.
- WTI Technical Analysis: Neutral- downward, though a leg-up can get as high as $80.00.
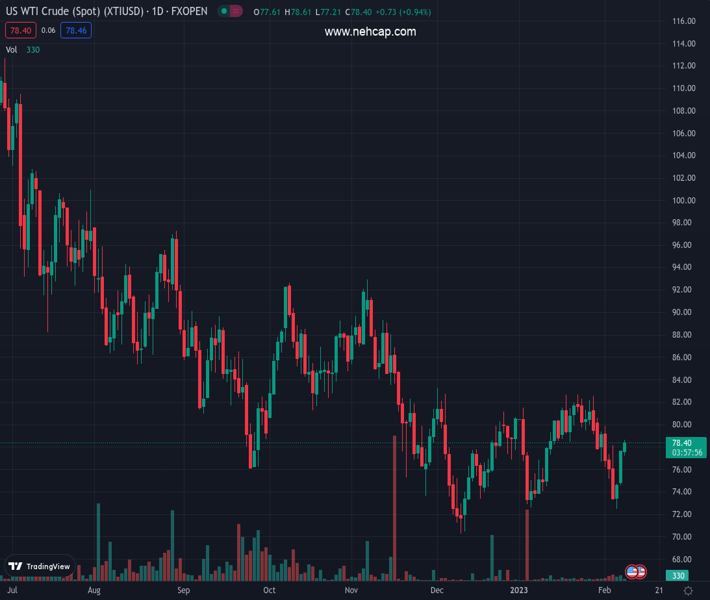
The pair currently trades last at 78.05.
The previous day high was 77.58 while the previous day low was 74.52. The daily 38.2% Fib levels comes at 76.41, expected to provide support. Similarly, the daily 61.8% fib level is at 75.69, expected to provide support.
Western Texas Intermediate (WTI), the US crude oil benchmark, edges up by a margin of 0.50% as a risk-on impulse hits the market, which, worried about an astonishing US jobs report, expected a hawkish tilt of Federal Reserve (Fed) Chair Jerome Powell, on Tuesday. Nevertheless, Powell’s muted response gave the green light to traders seeking risk. At the time of writing, WTI is trading at $77.93 per barrel.
WTI has recovered from diving toward the weekly lows of $72.30 on Monday. Expectations after last Friday’s Nonfarm Payrolls report for January added that the US economy added more than 500K jobs, pressured investors as they scrambled to square off their positions in riskier assets ahead of yesterday’s speech by Jerome Powell.
Powell said interest rates would need to increase if solid labor market data threatened to derail the Fed’s progress to curb inflation. However, he declined to give any forward guidance regarding future rate hikes and their size.
That said, investors’ worries faded as higher interest rates in the United States (US) suggested the greenback could strengthen, which means oil prices are high for buyers holding other currencies.
The reopening of China after relaxing Covid-19 restrictions is expected to support the demand for fuel. In the meantime, the Organization of Petroleum Export Countries and its allies (OPEC+) decided to keep crude output unchanged, as an Iranian official said the cartel is likely to stick to its current policy on Wednesday.
Nevertheless, a solid inventory report from the US capped oil prices, as an increment in supply makes oil cheaper. The US Energy Information Administration (EIA) revealed that oil production in the US rose to its highest level since April 2020.
Technically speaking, WTI remains neutral to downward biased, and the ongoing correction might offer sellers better entry prices. Nevertheless, if WTI’s bulls reclaim the 50-day Exponential Moving Average (EMA) at $78.71, a move toward the $80.00 figure is up for grabs. However, a resumption of the downtrend is likely to happen once WTI dives below the 20-day EMA at $77.70. Once cleared, oil prices could slide towards the February 7 low of $74.40, ahead of the weekly low of $72.30.
Technical Levels: Supports and Resistances
XTIUSD currently trading at 78.05 at the time of writing. Pair opened at 77.47 and is trading with a change of 0.75 % .
| Overview | Overview.1 | |
|---|---|---|
| 0 | Today last price | 78.05 |
| 1 | Today Daily Change | 0.58 |
| 2 | Today Daily Change % | 0.75 |
| 3 | Today daily open | 77.47 |
The pair is trading below its 20 Daily moving average @ 78.9, above its 50 Daily moving average @ 77.58 , below its 100 Daily moving average @ 80.95 and below its 200 Daily moving average @ 90.5
| Trends | Trends.1 | |
|---|---|---|
| 0 | Daily SMA20 | 78.90 |
| 1 | Daily SMA50 | 77.58 |
| 2 | Daily SMA100 | 80.95 |
| 3 | Daily SMA200 | 90.50 |
The previous day high was 77.58 while the previous day low was 74.52. The daily 38.2% Fib levels comes at 76.41, expected to provide support. Similarly, the daily 61.8% fib level is at 75.69, expected to provide support.
Note the levels of interest below:
- Pivot support is noted at 75.47, 73.47, 72.41
- Pivot resistance is noted at 78.53, 79.58, 81.58
| Levels | Levels.1 |
|---|---|
| Previous Daily High | 77.58 |
| Previous Daily Low | 74.52 |
| Previous Weekly High | 80.61 |
| Previous Weekly Low | 73.36 |
| Previous Monthly High | 82.68 |
| Previous Monthly Low | 72.64 |
| Daily Fibonacci 38.2% | 76.41 |
| Daily Fibonacci 61.8% | 75.69 |
| Daily Pivot Point S1 | 75.47 |
| Daily Pivot Point S2 | 73.47 |
| Daily Pivot Point S3 | 72.41 |
| Daily Pivot Point R1 | 78.53 |
| Daily Pivot Point R2 | 79.58 |
| Daily Pivot Point R3 | 81.58 |
[/s2If]
Join Our Telegram Group
")


