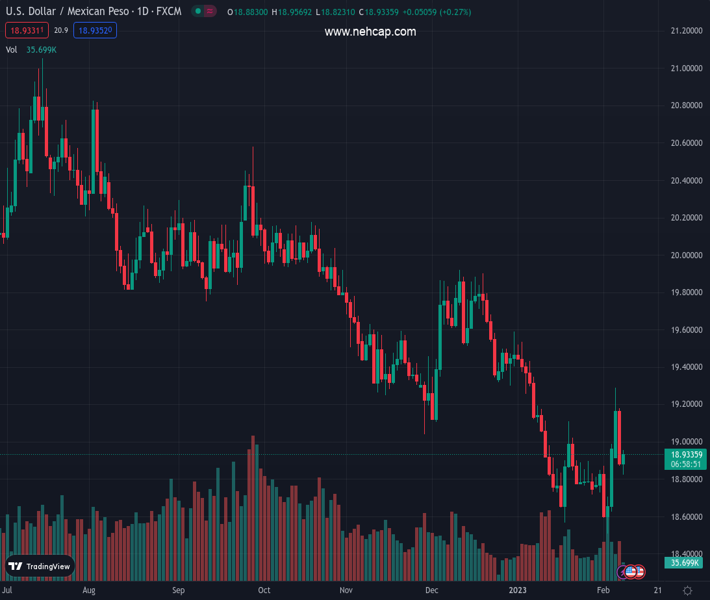
#USDMXN @ 18.9348 recovers some ground after dropping to weekly lows of 18.8231. (Pivot Orderbook analysis)
…
This is a premium post.
[s2If !current_user_can(access_s2member_level4)]Please register for PREMIUM VERSION HERE to read full post below containing analysis. In case of any error or you think you are not able to read the full post below, please email us at support#nehcap.com [lwa][/s2If] [s2If current_user_can(access_s2member_level4)]
- USD/MXN recovers some ground after dropping to weekly lows of 18.8231.
- Despite the ongoing upward correction, the USD/MXN is still downward biased.
- USD/MXN: Failure to crack 19.0000 could exacerbate a retest of the YTD lows of 18.50.
The pair currently trades last at 18.9348.
The previous day high was 19.1794 while the previous day low was 18.872. The daily 38.2% Fib levels comes at 18.9894, expected to provide resistance. Similarly, the daily 61.8% fib level is at 19.062, expected to provide resistance.
The Mexican peso (MXN) is losing ground against the US Dollar (USD) after recovering some ground on Tuesday, following “dovish” perceived remarks by the US Federal Reserve (Fed) Chair Jerome Powell. The USD/MXN dropped from around 19.1783 towards the week’s lows at 18.8691, but on Wednesday, the buck is recovering. At the time of writing, the USD/MXN exchanges hands at 18.9475, above its opening price by 0.17%.
Before Wall Street opened, the USD/MXN pair was trading at around the day’s lows, around 18.8231. However, a risk-off impulse increased demand for the US Dollar, so the USD/MXN is moving upwards.
The USD/MXN daily chart suggests further downside is expected, but the ongoing correction could open the door for further gains. At the time of typing, the USD/MXN has broken the 20-day Exponential Moving Average (EMA) at $18.9134 and could extend its gains towards 19.0000, a psychological resistance. A breach of the latter and the USD/MXN could rally toward January 19 daily high at 19.1085.
For the resumption of the downtrend, the USD/MXN needs a break below the 20-day EMA at 18.9134. Once cleared, that would expose critical support levels. Firstly, the February 7 low of 18.8691, followed by the day’s low at 18.8231, and then the YTD low at 18.50
Technical Levels: Supports and Resistances
USDMXN currently trading at 18.9069 at the time of writing. Pair opened at 18.89 and is trading with a change of 0.09 % .
| Overview | Overview.1 | |
|---|---|---|
| 0 | Today last price | 18.9069 |
| 1 | Today Daily Change | 0.0169 |
| 2 | Today Daily Change % | 0.0900 |
| 3 | Today daily open | 18.8900 |
The pair is trading above its 20 Daily moving average @ 18.8312, below its 50 Daily moving average @ 19.238 , below its 100 Daily moving average @ 19.5137 and below its 200 Daily moving average @ 19.8253
| Trends | Trends.1 | |
|---|---|---|
| 0 | Daily SMA20 | 18.8312 |
| 1 | Daily SMA50 | 19.2380 |
| 2 | Daily SMA100 | 19.5137 |
| 3 | Daily SMA200 | 19.8253 |
The previous day high was 19.1794 while the previous day low was 18.872. The daily 38.2% Fib levels comes at 18.9894, expected to provide resistance. Similarly, the daily 61.8% fib level is at 19.062, expected to provide resistance.
Note the levels of interest below:
- Pivot support is noted at 18.7816, 18.6731, 18.4741
- Pivot resistance is noted at 19.089, 19.2879, 19.3964
| Levels | Levels.1 |
|---|---|
| Previous Daily High | 19.1794 |
| Previous Daily Low | 18.8720 |
| Previous Weekly High | 18.9885 |
| Previous Weekly Low | 18.5082 |
| Previous Monthly High | 19.5361 |
| Previous Monthly Low | 18.5663 |
| Daily Fibonacci 38.2% | 18.9894 |
| Daily Fibonacci 61.8% | 19.0620 |
| Daily Pivot Point S1 | 18.7816 |
| Daily Pivot Point S2 | 18.6731 |
| Daily Pivot Point S3 | 18.4741 |
| Daily Pivot Point R1 | 19.0890 |
| Daily Pivot Point R2 | 19.2879 |
| Daily Pivot Point R3 | 19.3964 |
[/s2If]
Join Our Telegram Group
")


