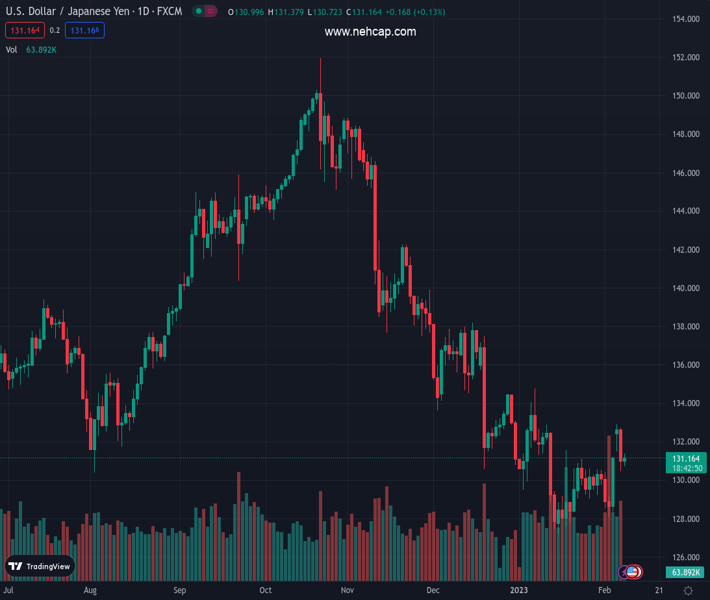
#USDJPY @ 131.169 has rebounded after dropping below 131.00 posts US Biden’s SOTU commentary. (Pivot Orderbook analysis)
…
This is a premium post.
[s2If !current_user_can(access_s2member_level4)]Please register for PREMIUM VERSION HERE to read full post below containing analysis. In case of any error or you think you are not able to read the full post below, please email us at support#nehcap.com [lwa][/s2If] [s2If current_user_can(access_s2member_level4)]
- USD/JPY has rebounded after dropping below 131.00 posts US Biden’s SOTU commentary.
- US Biden has made a proposal of taxing billionaires by raising tax slab of corporate buyback four times.
- A recovery from USD/JPY indicates that the impact of BoJ’s stealth intervention is fading away.
The pair currently trades last at 131.169.
The previous day high was 132.71 while the previous day low was 130.48. The daily 38.2% Fib levels comes at 131.33, expected to provide resistance. Similarly, the daily 61.8% fib level is at 131.86, expected to provide resistance.
The USD/JPY pair has sensed a buying interest after correcting below 131.00 in the Asian session. The asset has picked demand as the risk profile is expressing caution amid commentary from US President Joe Biden while addressing his second State of the Union (SOTU) and first in front of a divided Congress.
A consideration of taxing high net-worth individuals in the United States by quadrupling the tax on corporate stock buybacks has resulted in some losses in the S&P500 futures. Apart from that, a proposal of passing legislation to stop big tech from collecting personal data on children might weigh on the 500-US stock basket futures. Therefore, a decline in the risk appetite of the market participants is highly expected.
About relations with China, US Biden commented “We are committed to working with China where it can advance American interests and benefit the world, “If China threatens US sovereignty, the US will act to protect the country.
The US Dollar Index (DXY) is demonstrating a subdued performance as the hawkish interest rate guidance from Federal Reserve (Fed) chair Jerome Powell on Tuesday failed to improve the safe-haven appeal. Fed Powell shrugged off rumors pertaining to a pause in the policy-tightening spell by the Fed, citing that the strong labor market report is the reason why the central bank believes that a hasty decision of sounding dovish could trigger inflation projections on a higher side.
The USD Index displayed sheer volatility despite Minneapolis Fed President Neel Kashkari telling CNN Tuesday that the labor market is still too hot and that it makes it harder to bring inflation down, as reported by Reuters. He further added “We may have to hold rates at a higher level for longer,”
On the Japanese Yen front, it seems that the impact of the Bank of Japan (BoJ) stealth invention in the FX domain to provide support to the Japanese Yen is fading away. The street is expecting the forecast for the Japanese Yen to be based on the selection of BoJ Governor Haruhiko Kuroda’s successor.
A note from OCBC states “Focus this week will be on the list of BoJ nominees that is likely to be presented to parliament on 10 February though there are reports suggesting a delay to next week. Amamiya’s appointment would be most supportive for the USD/JPY upside while Yamaguchi’s appointment could weigh down the Japanese Yen.
Technical Levels: Supports and Resistances
USDJPY currently trading at 131.2 at the time of writing. Pair opened at 131.09 and is trading with a change of 0.08 % .
| Overview | Overview.1 | |
|---|---|---|
| 0 | Today last price | 131.20 |
| 1 | Today Daily Change | 0.11 |
| 2 | Today Daily Change % | 0.08 |
| 3 | Today daily open | 131.09 |
The pair is trading above its 20 Daily moving average @ 129.84, below its 50 Daily moving average @ 132.53 , below its 100 Daily moving average @ 138.55 and below its 200 Daily moving average @ 136.8
| Trends | Trends.1 | |
|---|---|---|
| 0 | Daily SMA20 | 129.84 |
| 1 | Daily SMA50 | 132.53 |
| 2 | Daily SMA100 | 138.55 |
| 3 | Daily SMA200 | 136.80 |
The previous day high was 132.71 while the previous day low was 130.48. The daily 38.2% Fib levels comes at 131.33, expected to provide resistance. Similarly, the daily 61.8% fib level is at 131.86, expected to provide resistance.
Note the levels of interest below:
- Pivot support is noted at 130.14, 129.19, 127.9
- Pivot resistance is noted at 132.38, 133.66, 134.61
| Levels | Levels.1 |
|---|---|
| Previous Daily High | 132.71 |
| Previous Daily Low | 130.48 |
| Previous Weekly High | 131.20 |
| Previous Weekly Low | 128.08 |
| Previous Monthly High | 134.78 |
| Previous Monthly Low | 127.22 |
| Daily Fibonacci 38.2% | 131.33 |
| Daily Fibonacci 61.8% | 131.86 |
| Daily Pivot Point S1 | 130.14 |
| Daily Pivot Point S2 | 129.19 |
| Daily Pivot Point S3 | 127.90 |
| Daily Pivot Point R1 | 132.38 |
| Daily Pivot Point R2 | 133.66 |
| Daily Pivot Point R3 | 134.61 |
[/s2If]
Join Our Telegram Group
")


