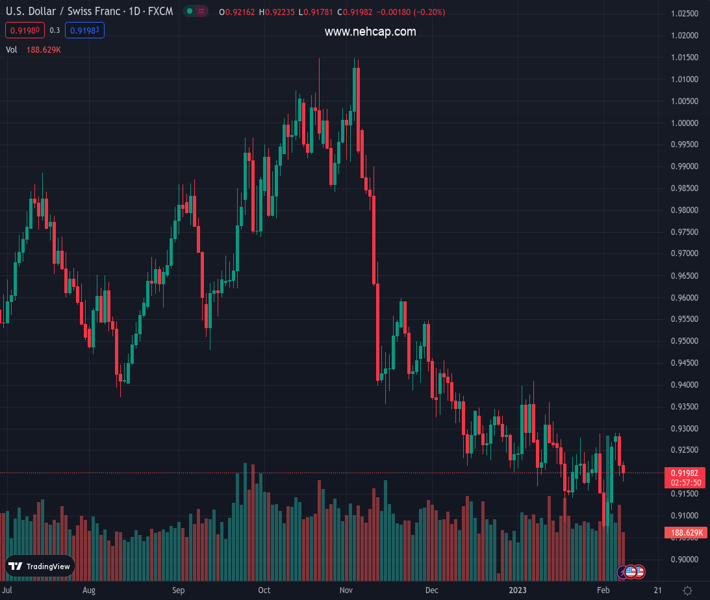
#USDCHF @ 0.91956 remains range-bound though it meanders slightly below the 0.9200 figure. (Pivot Orderbook analysis)
…
This is a premium post.
[s2If !current_user_can(access_s2member_level4)]Please register for PREMIUM VERSION HERE to read full post below containing analysis. In case of any error or you think you are not able to read the full post below, please email us at support#nehcap.com [lwa][/s2If] [s2If current_user_can(access_s2member_level4)]
- USD/CHF remains range-bound though it meanders slightly below the 0.9200 figure.
- USD/CHF: If it reclaims the 50-day EMA, it will shift neutral; otherwise, a resumption of the downtrend is likely.
The pair currently trades last at 0.91956.
The previous day high was 0.929 while the previous day low was 0.9192. The daily 38.2% Fib levels comes at 0.9229, expected to provide resistance. Similarly, the daily 61.8% fib level is at 0.9252, expected to provide resistance.
The USD/CHF drops for two consecutive days, though buyers are reclaiming the February 7 daily low of 0.9191, as they are eyeing to reclaim the 50-day EMA at 0.9299. At the time of writing, the USD/CHF exchanges hands at around 0.9200.
After dropping beneath 0.9200, the USD/CHF encountered solid support at around 0.9180s, beneath a two-month-old downslope resistance trendline, that turned support. It should be said that the USD/CHF pair is still neutral to downward biased, but with the 20-day Exponential Moving Average (EMA) resting at 0.9215, the USD/CHF could rally in the near term.
Nevertheless, oscillators like the Relative Strength Index (RSI) suggest that a bearish continuation is expected after crossing beneath the 50 mid-line. Contrarily, the Rate of Change (RoC) indicates sideways action.
For the USD/CHF to shift neutral, buyers must reclaim the 50-day EMA at 0.9299. Once that happens, then USD/CHF buyers could be poised to test the 100-day EMA at 0.9416. ahead of the 200-day EMA at 0.9478.
For a resumption of the downtrend, the USD/CHF needs to crack the February 3 daily low of 0.9112, which could pave the way for a retest of the YTD low at 0.9059.
Technical Levels: Supports and Resistances
USDCHF currently trading at 0.92 at the time of writing. Pair opened at 0.9219 and is trading with a change of -0.21 % .
| Overview | Overview.1 | |
|---|---|---|
| 0 | Today last price | 0.9200 |
| 1 | Today Daily Change | -0.0019 |
| 2 | Today Daily Change % | -0.2100 |
| 3 | Today daily open | 0.9219 |
The pair remains strongly bearish on the daily time frame. It trades below the 20 SMA @ 0.9215, 50 SMA 0.9277, 100 SMA @ 0.954 and 200 SMA @ 0.9614.
| Trends | Trends.1 | |
|---|---|---|
| 0 | Daily SMA20 | 0.9215 |
| 1 | Daily SMA50 | 0.9277 |
| 2 | Daily SMA100 | 0.9540 |
| 3 | Daily SMA200 | 0.9614 |
The previous day high was 0.929 while the previous day low was 0.9192. The daily 38.2% Fib levels comes at 0.9229, expected to provide resistance. Similarly, the daily 61.8% fib level is at 0.9252, expected to provide resistance.
Note the levels of interest below:
- Pivot support is noted at 0.9177, 0.9136, 0.908
- Pivot resistance is noted at 0.9275, 0.9331, 0.9373
| Levels | Levels.1 |
|---|---|
| Previous Daily High | 0.9290 |
| Previous Daily Low | 0.9192 |
| Previous Weekly High | 0.9288 |
| Previous Weekly Low | 0.9059 |
| Previous Monthly High | 0.9410 |
| Previous Monthly Low | 0.9085 |
| Daily Fibonacci 38.2% | 0.9229 |
| Daily Fibonacci 61.8% | 0.9252 |
| Daily Pivot Point S1 | 0.9177 |
| Daily Pivot Point S2 | 0.9136 |
| Daily Pivot Point S3 | 0.9080 |
| Daily Pivot Point R1 | 0.9275 |
| Daily Pivot Point R2 | 0.9331 |
| Daily Pivot Point R3 | 0.9373 |
[/s2If]
Join Our Telegram Group
")


