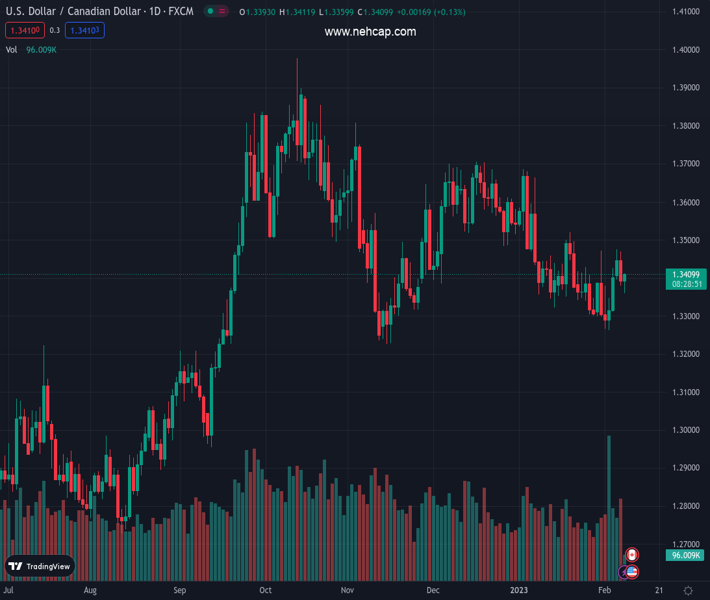
#USDCAD @ 1.34108 attracts some buyers near the 1.3360 area, or the weekly low touched on Wednesday. (Pivot Orderbook analysis)
…
This is a premium post.
[s2If !current_user_can(access_s2member_level4)]Please register for PREMIUM VERSION HERE to read full post below containing analysis. In case of any error or you think you are not able to read the full post below, please email us at support#nehcap.com [lwa][/s2If] [s2If current_user_can(access_s2member_level4)]
- USD/CAD attracts some buyers near the 1.3360 area, or the weekly low touched on Wednesday.
- A modest pullback in crude oil prices undermines the Loonie and lends some support to the pair.
- A weaker risk tone benefits the USD’s safe-haven status and contributes to the intraday bounce.
The pair currently trades last at 1.34108.
The previous day high was 1.3469 while the previous day low was 1.338. The daily 38.2% Fib levels comes at 1.3414, expected to provide resistance. Similarly, the daily 61.8% fib level is at 1.3435, expected to provide resistance.
The USD/CAD pair rebounds from the weekly low touched this Wednesday and climbs to a fresh daily high, which bulls now looking to build on the momentum beyond the 1.3400 mark.
Crude oil prices surrender a major part of the intraday gains to a one-week low, which, in turn, is seen undermining the commodity-linked Loonie. Apart from this, the prevalent risk-off mood benefits the US Dollar’s relative safe-haven status and assists the USD/CAD pair to attract some buyers near the 1.3360 region.
From a technical perspective, any subsequent move up might continue to confront stiff resistance near the top end of over a two-month-old descending channel. The said hurdle is pegged near the 1.3455 area and is followed by the last week’s swing high, around the 1.3475 zone, which should now act as a pivotal point.
A sustained strength beyond will be seen as a fresh trigger for bullish traders and set the stage for an extension of the recent recovery move from the lowest level since November 16. Some follow-through buying beyond the 50-day SMA will reaffirm the positive bias and push the USD/CAD pair beyond the 1.3500 psychological mark.
The momentum could get extended towards a technically significant 100-day SMA support breakpoint, now turned resistance near the 1.3530 region, above which bulls might aim to reclaim the 1.3600 mark.
On the flip side, the daily low, around the 1.3360 area, now becomes immediate support to defend ahead of the 1.3300 mark. A convincing break below will make the USD/CAD pair vulnerable to fall below the YTD low, around the 1.3265-1.3266 zone, and test the 1.3200 mark en route to the channel support, around the 1.3160-1.3155 zone.
Technical Levels: Supports and Resistances
USDCAD currently trading at 1.3403 at the time of writing. Pair opened at 1.3404 and is trading with a change of -0.01 % .
| Overview | Overview.1 | |
|---|---|---|
| 0 | Today last price | 1.3403 |
| 1 | Today Daily Change | -0.0001 |
| 2 | Today Daily Change % | -0.0100 |
| 3 | Today daily open | 1.3404 |
The pair is trading above its 20 Daily moving average @ 1.3382, below its 50 Daily moving average @ 1.3494 , below its 100 Daily moving average @ 1.3536 and above its 200 Daily moving average @ 1.3227
| Trends | Trends.1 | |
|---|---|---|
| 0 | Daily SMA20 | 1.3382 |
| 1 | Daily SMA50 | 1.3494 |
| 2 | Daily SMA100 | 1.3536 |
| 3 | Daily SMA200 | 1.3227 |
The previous day high was 1.3469 while the previous day low was 1.338. The daily 38.2% Fib levels comes at 1.3414, expected to provide resistance. Similarly, the daily 61.8% fib level is at 1.3435, expected to provide resistance.
Note the levels of interest below:
- Pivot support is noted at 1.3366, 1.3328, 1.3277
- Pivot resistance is noted at 1.3455, 1.3507, 1.3544
| Levels | Levels.1 |
|---|---|
| Previous Daily High | 1.3469 |
| Previous Daily Low | 1.3380 |
| Previous Weekly High | 1.3472 |
| Previous Weekly Low | 1.3262 |
| Previous Monthly High | 1.3685 |
| Previous Monthly Low | 1.3300 |
| Daily Fibonacci 38.2% | 1.3414 |
| Daily Fibonacci 61.8% | 1.3435 |
| Daily Pivot Point S1 | 1.3366 |
| Daily Pivot Point S2 | 1.3328 |
| Daily Pivot Point S3 | 1.3277 |
| Daily Pivot Point R1 | 1.3455 |
| Daily Pivot Point R2 | 1.3507 |
| Daily Pivot Point R3 | 1.3544 |
[/s2If]
Join Our Telegram Group
")


